
Fastenere

39%
Experiment success rate
20%
Conversion Rate Lift from Social Proof across Devices
57.1%
Overall Website Gain
37.07%
Revenue Contribution via IntelliSearch
🔧 How Fastenere.com Boosted Conversions with Targeted CRO Experiments
Fastenere.com is a leading U.S.-based supplier of industrial and commercial fasteners, offering over one million products across materials like stainless steel, brass, and galvanized options. With 13 nationwide locations and same-day shipping, the brand has built a reputation for reliability, scale, and customer trust.
1. Building Trust & Credibility
Payment Seals - Mini Cart (Desktop)
Problem:
Implementation:
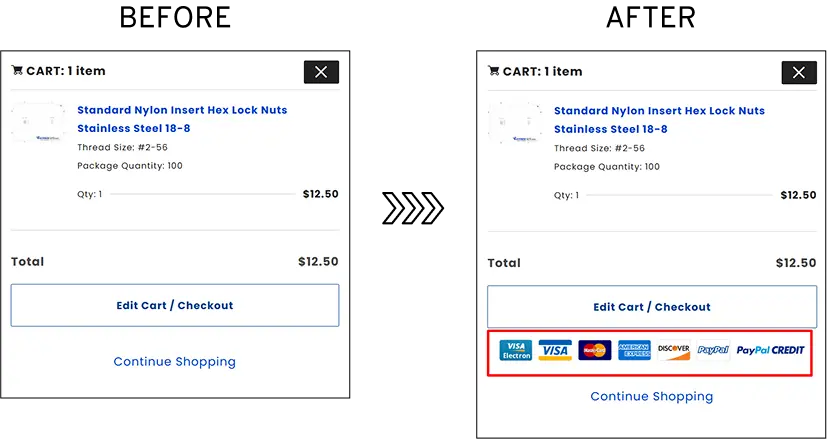
Results:
USPs Highlight (Mobile)
Problem:
Implementation:
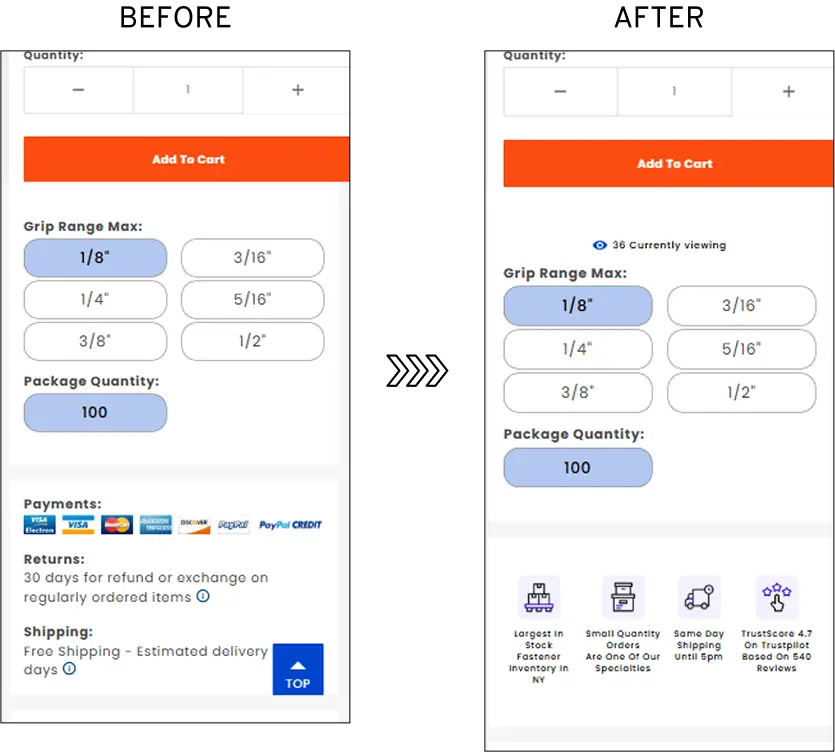
Results:
Social Proof (Desktop & Mobile)
Problem:
Implementation:
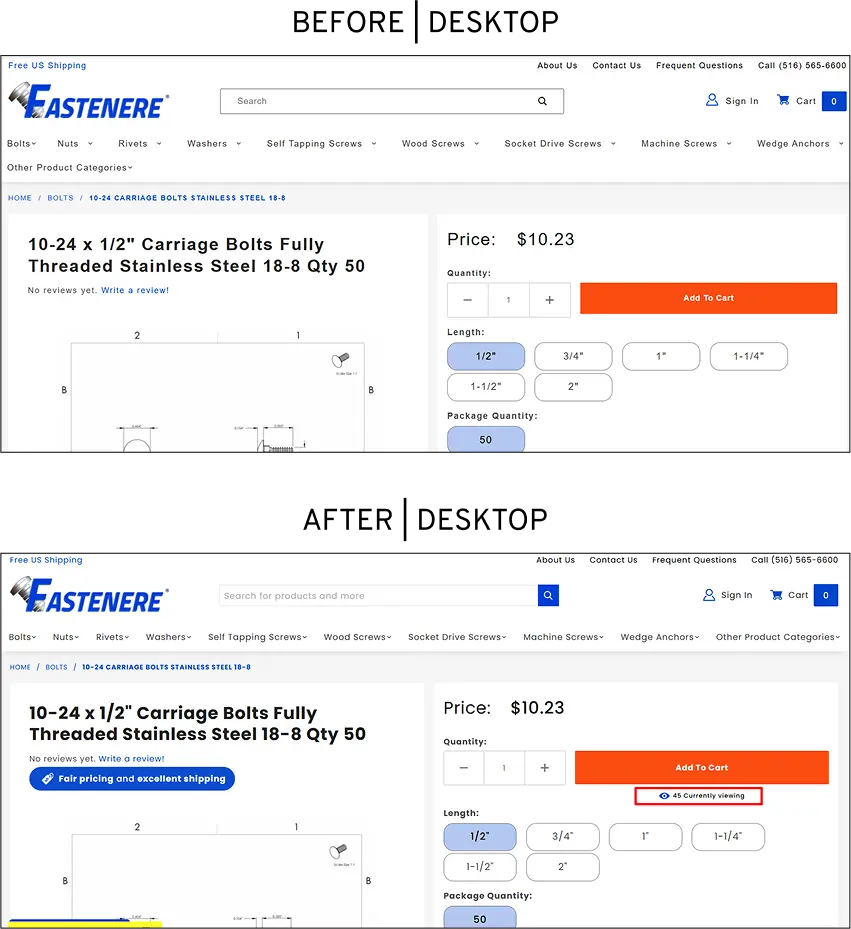
Results:
- Desktop: +8.63% campaign gain and +3.65% website gain
- Mobile: +6.23% campaign gain and +2.95% website gain
Post launching Social Proof on the website, we noted a conversion rate bump of 20% across devices.
2. Enhancing Product Quality Perception
Quality Prominence on Product Pages (Desktop & Mobile)
Problem:
Implementation:
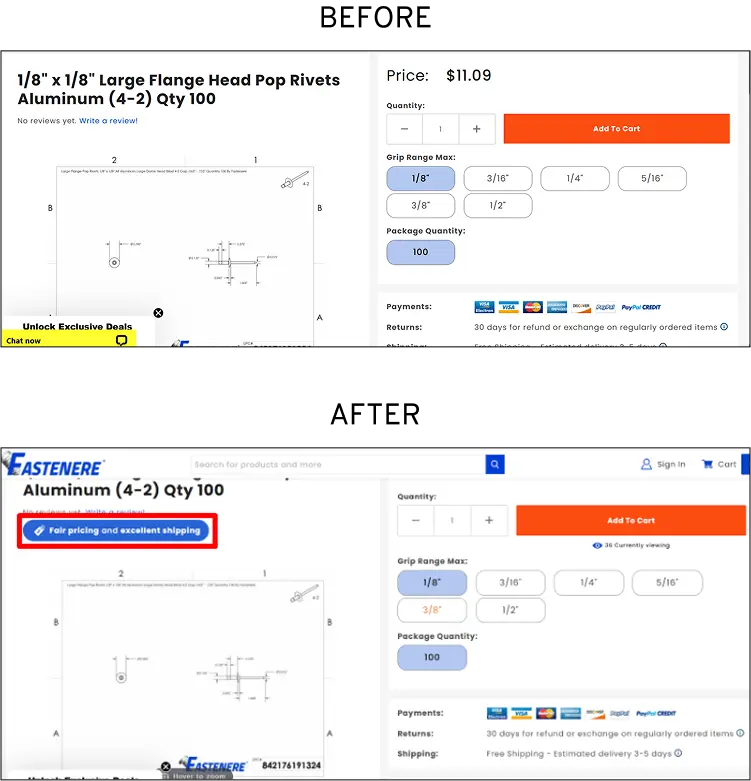
Results:
- Desktop: +26.30% campaign gain and +8.06% website gain
- Mobile: +8.01% campaign gain and +4.27% website gain
On account of this experiment, conversion rates across devices grew by 172%
3. Reducing Purchase Friction & Abandonment
FAQ Assistance (Mobile)
Problem:
Implementation:
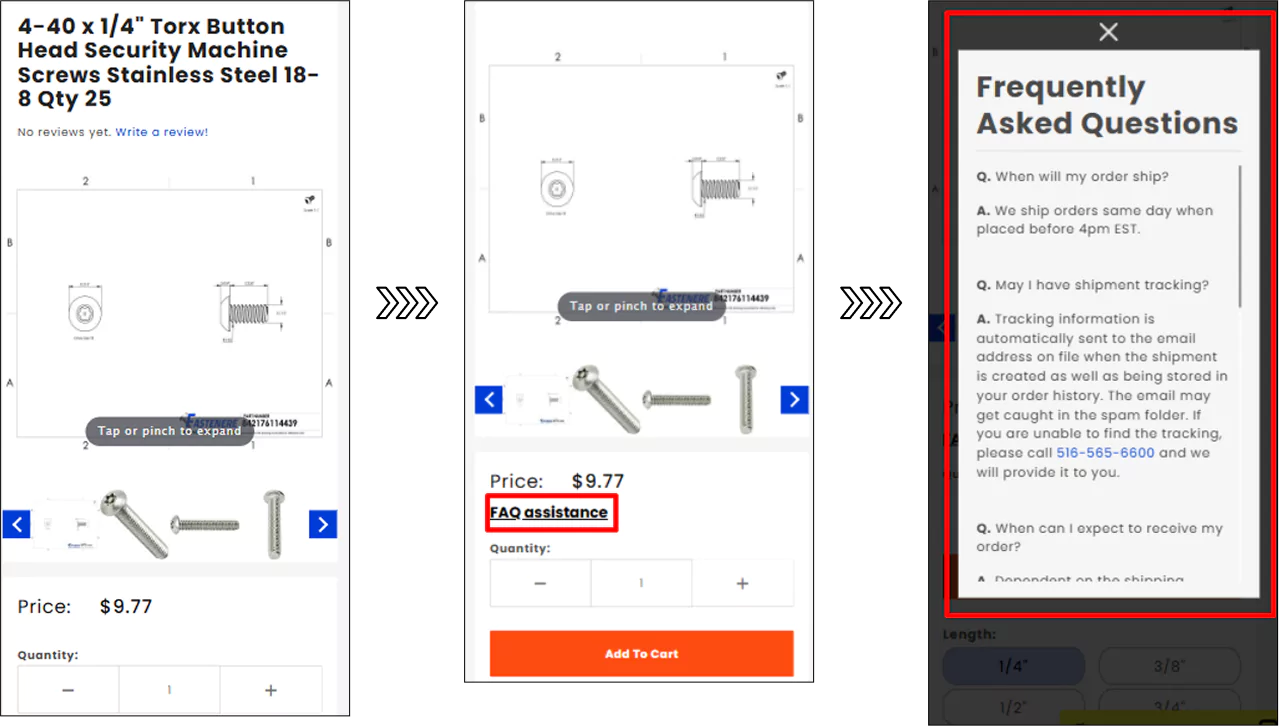
Results:
+17.67% campaign gain and +6.15% website gain.
4. Improving Navigation & Engagement
Category Images (Mobile)
Problem:
Implementation:
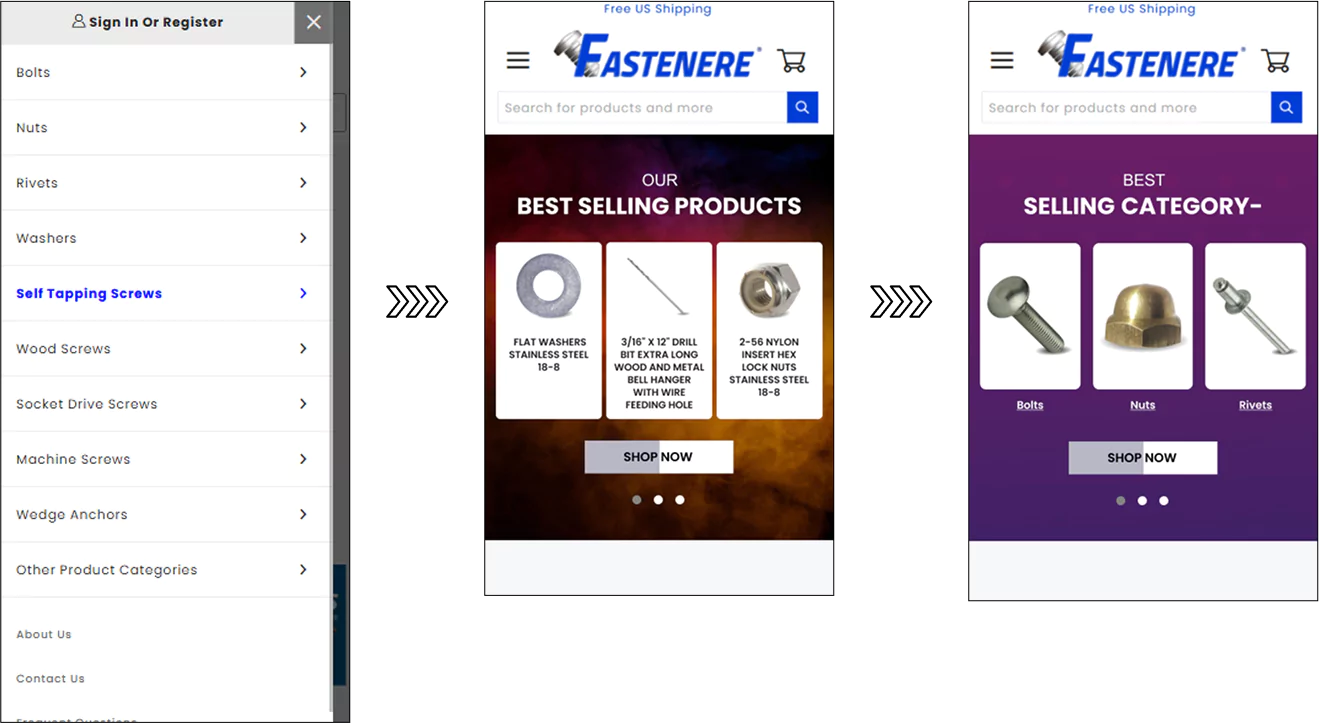
Results:
+12.26% campaign gain and +6.24% website gain.
Funnel movement from Home > Cart page saw an increase of 6% post succeeding this experiment on mobile.
IntelliSearch
Problem:
Implementation:
Before: Search usage was minimal, with poor engagement and no filters to refine results.
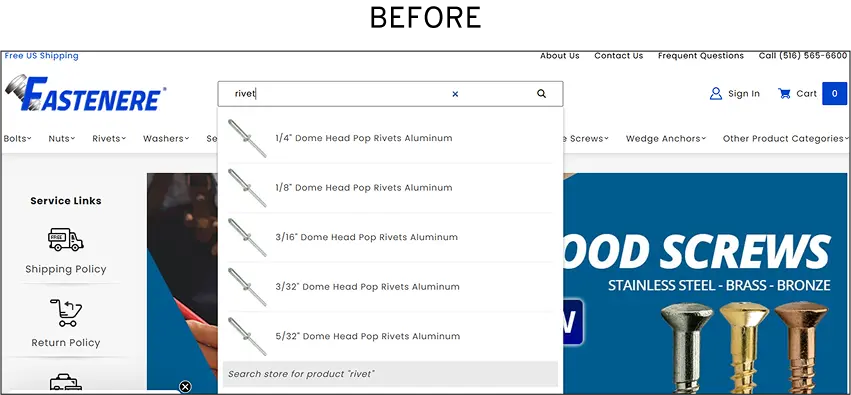
After: Introduced IntelliSearch with advanced filtering options (by category, specs, availability), predictive suggestions, and prioritized high-converting queries.
Results:
3.07% of users engaged with search (as opposed to 1% users earlier), yet this small group delivered outsized impact:
- +1107.8% lift in conversion rate.
- +1975% increase in revenue contribution.
Engagement Metrics:
- Page views/session: +180.8% increase.
- Users with search spent 12.5 min before buying vs. 5.94 min without search → showing search users explore more deeply before completing a confident purchase.
- CTR: 34.22% (↑20.4% improvement).
- Click position: 8.30 (↑5.6% closer to top).
Although only ~3% of visitors used site search, they were 11x more likely to convert and generated 20x more revenue per user, proving IntelliSearch as a critical driver of high-intent conversions.