On-Demand
Improving Key Business Health Metrics (eCommerce)
What gets measured, gets managed — is true for every business.
But there are hundreds of metrics out there, and it can get overwhelming pretty fast.
So, you need to narrow it down — to the metrics that help you answer THREE key questions:
- Is my business model and overall business healthy?
- Is my marketing working?
- Is my website working to convert shoppers effectively?
And this is what we’ll talk about this time.
What you’ll learn in this live session:
👉 Key business health metrics that store owners should track
👉 Ways to improve these metrics, with some great examples


About the speaker

Shekhar Kapoor
VP, Marketing
Convertcart
Shekhar Kapoor (VP at Convertcart) has worked with 500+ online brands, including Squatty Potty, Prep Expert, and USA Hockey Assn., and helped them boost sales exponentially.
Shekhar Kapoor
VP, Marketing
Convertcart
SESSION REPLAY – IMPROVING KEY BUSINESS HEALTH METRICS (ECOMMERCE)
Welcome everyone, thanks so much for joining us. I'm so glad that we have this turnout, and I'm excited to walk you through some of the stuff that we have here. We've tried and kept it as detailed as possible while keeping it as simple as possible.
In an earlier webinar I kind of nerded out on customer psychology and I got feedback that I probably nerded out too much, so I'm not going to try and do that today, although if you want me to, I'm happy to continue to double click on some of the stuff that I have here.
How to Use This Webinar
As an aside, the other thing that is going to be important is some of the information that I walk you through today might seem like it's obvious stuff. There are a couple of metrics in there which are “hey, you know what, everybody knows I need to track that,” so there's nothing wrong with that, but I still want to give you a deeper view of how we look at it.
In my personal experience, I think I would have seen more than 500 Google Analytics accounts, if not more, and Convertcart as a whole optimizes conversions for more than 300 businesses currently. So we run more than 800 experiments a year. We also manage email marketing for more than 100 businesses, and so we send millions of emails every day.
Generally speaking, one of the things that really matters with metrics is not only knowing what to track, but also tracking them in a consistent way because trends are where insights are. You know, you can see, for example, that your conversion rate is one and a half percent, and you're like, “Okay, all right, I have a one and a half percent conversion rate.”
But then, when you see that metric over a period of a few weeks and how it trends, and what makes it trend upward versus downward — when you run a sale on your email, what happens? When you change your marketing? When you go and advertise on Bing, what happens? And so on and so forth. It gives you a view of what works for you and what doesn't work for you.
Trend always gives you insights. You know, it's about observations versus insights — there's a big difference.
The other thing I want to solve for with today's webinar is perspective versus perception. When you look at a metric, you create a perception of what it tells you.
For example, if your ROAS has gone down, which is your return on ad spend, you essentially perceive that either your ads are not doing well enough or your site isn't converting. That's your perception. But perspective matters, which means the way that you perceive something — at the end of the day your perspective is what creates your perception.
So, with today, all of the metrics that I'm going to talk about, I want to change your perspective. I want to change the way you look at some of these metrics and perceive them. And if I'm successful in doing that for even one metric, this webinar is a win for me. I hope it's a win for you. I hope you get stuff that you can take away, implement, get into Google Analytics while I'm talking, or figure out someone who can take a look at your data and inform your strategy in a little bit more detail.
Generally speaking, at Convertcart we are extremely data-driven. Not only about our customers and the way we do our things, but also for our own data. We look at data in a lot of detail, a lot of granular detail. We talk and meet about data every week, and we try and figure out a way to make things better. I feel that serves the business extremely well, and that curiosity serves the team extremely well. Everybody knows, at least at a high level, what their goals are, what they are chasing every week and every month, and I think that adds endless value to the business in the long run.
Getting Into the Metrics
Now, without further ado, let's get into what we intended to put across by even doing this webinar. My intention is not for you to track all of the metrics — there's too much to track. Google Analytics 4 isn't any better than UA, and generally speaking, most people are still learning how to get their data from GA4.
So first of all, if you don't have your GA4 setup properly, that's one really important thing you want to solve for. Brandon has said GA4 sucks — there's no better way to put it. But you know what, it can be a powerful tool if you've configured it the right way and if you are someone who can get into building reports for yourself. We do that for our customers, and some of the data it gives you is interesting.
Some of the data points I'm going to walk you through today — imagine if you had that data for your business, what would it mean to you? That's what I want you to think about.
But generally speaking, here are the metrics that I want us to be serious about.
Metric 1: Site Search Rate and Why It Matters
Let's get into the key metrics I want us to track. The first one is a metric which is inside of your site, which is site search rate. Now, here is how this metric generally is supposed to work.
I see people first of all not tracking this. For people that track this, they are generally looking at what percentage of my site visitors are even using search. Generally speaking, people who use search convert at least five times better compared to people who don't use search. So, search is by far the most important part of your site if you have multiple SKUs. If you are a single or two, or three SKU site, then obviously search doesn't matter for you, but I'll spend a couple of minutes on this.
Some basic stuff that people get wrong is: search bar not being prominent, not being compatible with mobile, being so hard to reach on mobile, being tucked away in one corner, bad search results, zero search results, it doesn't adapt to keywords, it doesn't correct bad spellings, it doesn't give suggestions. So there are a bunch of different things that could go wrong with search.
So use an effective smart search that can solve that for you.
In addition to that, there's another way to look at it. Generally speaking, there are two kinds of people that come to your site: people who know what they want and the ones that don't know what they want.
The ones who know what they want potentially reach you one of two ways — you interrupted them on Facebook or Instagram, or TikTok with an ad, and they saw your product, and then they came, they had a need for it, and hence they came.
Or they Googled. They were looking for, for example, a massaging gun, and they found your website on Google search results or your ad on Google search results, and then they clicked and came.
So there is either intent present or not present. Either way, depending on where they came from — whether they came from an interruption or they came from an intent perspective — making it easy for them to reach the goal, which is a product that solves their problem, is absolutely of epitome importance.
If you don't want to prioritize your search, if you don't think your search is that important to your experience, then eliminate it completely — which means you have a lower number of products, search doesn't matter, and bring your top couple of products that you really are driving sales with right on the homepage. You don't need a website with five pages.
You don't need to tell a story. Just focus on selling, and through selling tell a story — talk about the product, the value prop, everything else.
But if you have a search and if it matters to your business, if you want people to come to your site and look for things and find something that works for them, then search is absolutely absolutely important.
Generally speaking, have images within search.
- Can you add voice search as a capability?
- Can you create a trending searches section?
- Can you add suggestions?
- Can you improve?
- What are the different things that you can do to take your search to the next level?
The metric that I want you to track is conversion rate without search — so people who do not use search, what is the rate at which they convert — and for people who use search, what is the rate at which they convert. Generally speaking, people who use search should be converting five times better. If it's less than five times, that means your search results are not good enough. If it's more than five times, I mean, it's still not good enough — so try better — but I'm just saying that's a benchmark you want to have.
In addition to that: how much of your organic traffic is reaching product pages and completing product discovery? So the real metric to track here is completion of product discovery — what percentage of your total traffic reaches a product page.
This number for you is super important. So if you have 50k visitors or 100k visitors and only 20k make it to the product page, you've lost 80k to bounce, to lack of having found a product that they like, to lack of liking the brand, to lack of intent, to lack of quality of visit — whatever it is.
So generally speaking, that's what you're trying to get after — understanding how many people complete product discovery.
Metric 2: Add to Cart Rate and the Story It Tells
Let's go to the next metric. If you have questions, feel free to put them in the chat; otherwise I'll just keep going and we can go from there.
The next one is really simple — it's add to cart rate. But this metric has so much inside of it. This metric has so much to tell you that I sometimes feel people overlook the story that this metric tells.
Think of a customer that adds a product to cart. The level of intent, interest, and motivation you need to actually do that — to actually go as far as putting a product in your cart — you are 100% a qualified customer.
Which means you are somebody who had intent, who wanted the product, who liked the product, who is convinced that they want to buy it at the price that you're selling, looking at the images that you have put up. And they trust you. They trust the brand. They trust the product.
So there's so many hoops you've already jumped.
I was watching the steeple race in the Olympics yesterday. I think the United States of America came second; the first one was Morocco.
And I was just looking at how they were kind of going through laps, and it reminded me — that's what we do for a living at Convertcart. We essentially make sure that the customer completes the steeple race that the entrepreneur has created for them. And I sometimes pity businesses that make it too hard for their customers to go and jump all of those loops.
So generally speaking, we spoke about product discovery completion — this is how many people reach a product page. And the next metric we look at is the add to cart rate.
This simply explains if you are able to convince people that there is value in what you're selling, and you're able to answer:
- Why should I buy?
- Why should I buy it right now?
- Why should I buy it from you?
- And why should I not buy it from someone else?
Those are the four most key persuasion questions we try to teach our sales team — why should you buy what you're selling?
And I think that's one of the interesting things about metrics: they puzzle us because, as entrepreneurs, we feel we have a product that the world needs. We stand behind it — or products that the world needs — but we fail to look at what goes wrong for that small percentage of the world that is visiting us.
I feel this metric tells a huge story. The site navigation, it could be the button, it could be trust, it could be distractions, it could be just generally poor user experience.
What I would recommend you do is make cart addition easy. First, by telling a story about the product and then doing all of the basics — adding trust, making the value prop extremely obvious, and making the purchase risk-free.
If you have a return policy, advertise it. If you have fast shipping, advertise it. If you have anything that can add value to the business, please.
One of our customers — QT Party, a longtime customer actually — we've been optimizing for them for a long time. They've gone through four site revamps while we've been optimizing. And so there's so much that we've done. And generally speaking, I would still stand behind them as a brand, as a recognizable way to solve the problem that they're solving.
So add to cart rate tells a huge story. Go back and look at your add to cart rate and then put that metric beside you, write it down on a piece of paper, and then go to your site and shop as a customer.
Metric 3: Micro Conversions and Their Role in Understanding Intent
Micro conversions — conversions are not everything. You know, sometimes you've just got to get a small buy-in to then go to the next level.
Back in high school, college, when you are asking someone out, you're not directly asking them to marry you. You're going through a few micro conversions. You're trying to have a first conversation. “Hey, can we go out sometime?” Even that takes a bit of time to gather courage and be sure about things. Micro conversions are those steps that allow your customer to say a few smaller yeses before you convert them.
And it's not only about email signups. There is a lot inside micro conversions that you can track. For example:
- Did they select a different language or currency?
- Did they click on a specific banner?
- Did they search for a specific product?
- Did they go and add a specific product to cart?
These are all micro conversions.
If they've searched — like the first metric that I spoke about — generally speaking, if you have a site that has multiple products and search is important, about 10% of your traffic should be searching. That means you have a micro conversion — meaning at least that percentage of your traffic, out of your 200k visits, at least 20k people had the time, intent, and motivation to write something in the search bar.
Let me ask you a question. Let's just say you have 10 people in your entire website traffic and 2 out of them made a search, and I put them in front of you, physically have them meet you in a café. How many of them will you convert? All of them. That is the conviction, the pitch that you would make as an entrepreneur to yourself.
Now extrapolate that to 20k people searching on your site or 10k people searching on your site. That's how many high-intent people came and asked you a question — said, “Hey, here is what I'm looking for.” So that micro conversion is extremely important.
But if you're not tracking some of these metrics, you don't know how much of your traffic is even high intent.
So the first filter to apply is: out of your paid traffic, organic, email, direct traffic — how many people are converting even at a micro level? That's the first step. If that number is not very high, your traffic quality is a problem. If that number is high, traffic quality is top notch — you don't need to fire your agency.
But if that number is really really low, your problem is not your UX. Your problem is who comes on your site and them not coming with the right intent.
I actually wrote a long post on Audience Network ads on my LinkedIn. I request you to go and follow me on LinkedIn or add me as a connection — or I'll do that maybe after the call. But Audience Network ads, for example, are complete crap. I saw an ad for scuba diving and I am eight hours away from the nearest beach. There's no reason for me to be seeing ads for scuba diving, for example.
As an aside, generally speaking, here's a way in which you could use micro conversions for your advantage.
In this case, a $35 product — a dress, in that sense — and what we are asking the customer to do is save the cart for later or remind me about the product later on. So some very small things that we're trying to do. And this only pops up for exiting users — so people who are exiting the site. This is an exit intent popup.
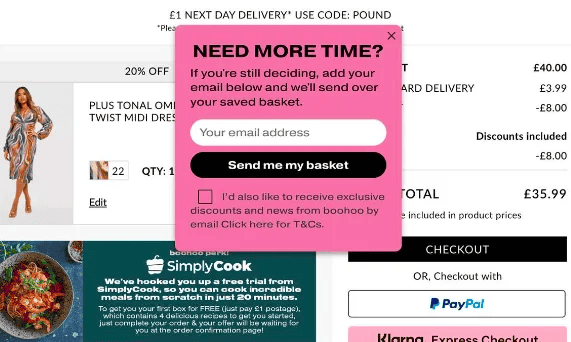
We also sometimes do exit intent surveys where if somebody's exiting the site, we pop a survey up and we ask them, “Hey, what happened? Did we do something wrong? Do you want us to fix something or do something?” That's generally what you are going to go on.
Metric 4: Conversion Rate — Why It’s a Lagging Metric
The fourth one is conversion rate. I'm not going to spend too much time on it. I'm just going to say a few simple things.
The metric as a whole — when you say, “Hey, my conversion rate is 2 percent, can I get this to 3 percent?” — that statement in itself has no value. It is a great goal to have, it is fantastic, but it's a lagging metric. At a fundamental level, conversion rate is a metric that exists after the event has already happened. So you cannot effectively fix your conversion rate if you are solving for your conversion rate.
I'm just going to try and say this again in a different way.
Let's say you're trying to lose weight, like me. For me, I can either say, “I want to lose a kilo a week,” or “I want to lose a few pounds a week,” or I can say, “I'm going to try and lose a few grams today.” Or I can break it down further and say, “I'm going to try and eat under 400 calories in all my meals.” Or I can break that down further and bring it down to macros.
The key to solving conversion rate is to break it down into several pieces. And how you do that is really simple:
1. Break it down by device — is mobile a problem or is desktop a problem? I'm not even going to talk about tablet.
2. Then break that down by channel — let's say mobile is the problem. Within mobile, what is the biggest problem:
- paid
- direct
- organic
3. Within that, what is the problem — is it new users or is it old users?
You’ll find pockets of your conversion rate that are performing so poorly that you would want to go after them first. And if you just solve for those, it would make a lot of sense.
The other thing, which is completely counterintuitive, is you will find pockets that are performing super well — and there is a case for them to perform four times better. So ignore all of the laggards, ignore all of your low intent traffic that you're getting from bad ads, and focus purely on what works.
For example, we run email marketing, as I said, for more than 100 businesses. After they sign up with us, they drive at least 30 percent of their revenue from email. And we have a very simple formula to making that happen: 60 percent of the email revenue comes from workflows — which is people who have shown some behavior on the site. If they are meaningfully enough engaged with enough personalization, they will come back. There's a high chance that's going to happen.
So we track those metrics and we figure out a way to make it happen.
Again, my limited point is: there are a lot of generic reasons for why conversion rate can be low. You can do a lot of generic stuff. But I feel the first step of solving it is to break that metric down into 20 different things, and then you can make all of the iterations that you want. You can make your experience seamless across devices, tell a story, figure out a way to make features more accessible, make product discovery easy — all of the stuff that I've been talking about over several webinars and will continue to talk about.
I think the first step is to track the metric super well.
Metric 5: Average Order Value — Why It Drops and How to Read It
Average order value — again, a super important one. You know, this is something that I feel is not intellectualized enough. As opposed to conversion rate, I feel people track conversion rate and try to solve for it more actively than they solve for AOV. And I'll talk about a few other metrics in a bit that affect AOV in a significant way.
But AOV in general, in the US — if I just talk about that market alone — is falling. That's something we know for a fact. We've seen that across customers as well. Because in the whole hope to convert better and the hope to provide better value, lower prices are a very active strategy.
Whereas sometimes businesses also resort to selling lower gross margin products, discounting too much, losing the brand image in that process. And generally speaking, what low average order values say is that people generally don't engage with higher value products on your site. They don't see you as someone who can sell them high-value stuff. You either have a stock-related issue or you're not promoting them well enough, or there are other issues.
How you optimize for average order value — the standard stuff is bundling and convincing people for why they should buy higher-value products. But I just feel that data here has a lot of answers which are often ignored.
For example, just to put it in a simple way: look at your highest-value customers — people with high customer lifetime value. Your VIP customers. That's a cohort we create for our customers a lot. There are these 40 or 50 customers that have bought from you again and again and again, or they have bought high-value products from you.
Generally, for sites that sell products upwards of $80 — which means that their average basket size is that much — conversion rate is lower. Jewelry websites — we work with a bunch of them — their conversion rate is point X Y Z. It's always super low. So trust plays a massive role in driving that up and really solving for it.
But when you uncover the data behind your highest-paying customers, you realize there are several other factors that drive a high-value customer.
There are two core pillars that drive higher average order value:
1. Driving the right demand.
If you don't have customers that can pay that value, you will never be able to sell your higher-value products. Example: You are a Lululemon store next to a Walmart. Nothing wrong with either brand, but the overlap in customers is not huge — maybe 30–35 percent. But place that same Lululemon store next to a Whole Foods and it's a completely different story.
2. How are you dealing with them once they are with you?
Bundling. Showing value. Making pricing transparent.Explaining the justification:
- Why is this leather bag $600?
- It's made in the US.
- It's handmade.
- We have a lifetime guarantee — a lifetime handshake.
- If anything ever happens, we replace or repair it.
All of that adds a ton of value.
Metric 6: Inventory Turnover — The Silent Business Killer
Inventory turnover — this is something that has brought down the GOATs of e-commerce and the GOATs of retail in general. The number one reason why retail suffers in the long run is excess inventory. It’s money spent on stuff that did not get sold. And that's generally rooted in lack of prediction of demand, figuring out how you could restock, all of those things that are basic to the business — but I'm surprised how many people still face that issue.
I was recently speaking to a hardware store that stocks more than 50,000 SKUs. And we were doing an analysis — a Pareto analysis — essentially figuring out which products drive a large share of their revenue. And our realization was that just 400 products were driving 90% of the revenue. And out of those 400 products, 50% were different every month.
Can you imagine the complexity that the business would have if you were in a place where next month 40–50 percent of your revenue was driven by a completely different set of products? So they were always in this place where they had to stock this massive set of SKUs, and they had no option because their entire demand and strategy sat on the availability of SKUs. They would not rank organically if someone looking for a very specific size of a tool or a car part does not land on their site.
So if you are a business that complex, all the best. But there are still ways to solve for product turnover.
If you are a simpler business that still wants to solve this problem and wants to have just-in-time inventory as much as possible, you could do some really simple things:
- Pre-orders
- Mystery drops
- Flash events
- Flash sales
- Anything that gets stock moving
There are so many ways to track it. But I don't know if enough people track this.
What we'll also do is: after this webinar we'll send you a document of how to calculate some of these. I'm not sure how many people might know how to calculate it. So we'll send you a calculator for some of these metrics, and also maybe a quick line on where to find them in GA4. Because inventory turnover is not in GA4 — but something like average session duration is in GA4.
I hope there are no questions. I have your attention, and everybody's awake. There's too much. And I hope I'm not nerding out too much like I did in the last couple of webinars.
Metric 7: Average Session Duration — The 47-Second Window
Okay, let's get into average session duration — 47 seconds. That's how long you have to impress.
This is something I've mentioned in my earlier webinars also, but we have seen that there's a window that matters. In fact, let me just put this in a different way.
When I started out my career in sales, I was able to coach a few people early on. I used to read a lot of books about sales and persuading people and talking and presenting and that kind of stuff. And we used to always say one very simple thing — you have 4 seconds before someone has judged you for who you are and what you're all about when you're trying to call them, when you make a sales call. You have 4 seconds before someone has already made a judgment on who you are if you're standing in front of them.
When you see someone walking towards you, you've made a judgment almost instantly. Although I think people in today's time are significantly more open-minded than they were back in the day, I still feel that is true.
On the website though, you're lucky — you have 47 seconds. So you're about 10 times better off than talking to someone on the phone. But I feel it's not leveraged well enough.
For example, even today, 80% of the e-commerce sites that I see — set up on Shopify or any other platform — have this huge banner on the homepage that is rotating with huge text, massive text, that talks about one product that is not relevant to all of your customers. You've launched a new collection and you think that everybody wants it. And so it's not a productive use of your first fold.
If 70% of the first fold of your site is saying just one thing, you want to really rethink how you want to use that attention span. Everyone is a goldfish — practically everyone is a goldfish. When you're scrolling on TikTok or Instagram, how much time do you give to each? Nothing. Which is why when you're generating social media content, the first 3 seconds really matter — which is why you see a lot of people doing all kinds of stupid stuff in the first 3–4 seconds so that you stop scrolling and look at the rest of the 54 seconds of content.
Imagine how much of a customer's attention you have — 47 seconds. So what is failing?
Generally speaking:
- clutter
- not-focused design
- poor copy
- lack of interactive elements
- key value prop not being clear
- navigation getting complicated
Sometimes I feel that the standard design of a website just works. Over-intellectualization of design and UX makes it harder for people to shop, instead of easier.
So something to think about is: would animations and videos be helpful? Videos generally perform super well.
Do popups in the right way. Don’t interrupt the journey too quickly. Another thing most people do: a 10% off popup shows up 15 seconds into the journey. I don't even know who you are — how will I give you my email ID for 10% off for something I don't even know?
Here's what I want you to do. If you're on Mac, do Command + Shift + N. If you're on Windows, do Control + Shift + N. Open a new incognito tab and just type in your website. See how it performs for the first 45 seconds. Put a timer and see: what is the most important thing you want people to know about your brand — did that get communicated in the first 45 seconds? If not, I'm sorry — that opportunity is missed.
Metric 8: Customer Acquisition Cost — The Most Dangerous Expense
Customer acquisition cost — this is a massive metric. And I'm going to walk you through some more metrics that are linked to this.
Do you calculate how much it costs to acquire a new customer? And acquiring a new customer meaning a new customer buying from you for the first time.
The way to calculate it is — and I'll also send the formula to you — there are many ways to calculate it, but the oversimplified way is: your total spend on acquisition of traffic divided by the total number of new purchasers that came in that month, who have never bought from you before.
If that number is too high, you will not break even on that customer anytime soon. It would mean that you have to make that customer buy twice or thrice for you to break even and be profitable on that customer. I think that much math we generally try and do.
If you're selling a $100 product — it costs you $50 to bring the product in, it costs you $10 to ship it, and $20 to sell it. You’re left with about 20 bucks. And in those 20 bucks you’ve got to pay salaries, you’ve got to make sure your site is up and running, continues to do that, and pay for any other auxiliary expenses that are not a part of your gross margin. Because you know, then you have your contribution margin, and then finally your net profit.
Customer acquisition cost is generally the number one thing that brings down that contribution margin in the most prominent way. It’s the one that really kills. Because with e-commerce, if this is not something that's kept under control — especially during sales periods, November, December for the US, and a few other months for other countries — that is the time when sales get crazy. That's when ads are expensive. That's when you are essentially competing for attention on email, competing for attention on SEO. And so it really matters what your customer acquisition cost is.
The causes behind this can be many, but I would hold your agency accountable for it:
- high costs from inefficient segmentation
- poor creatives
- poor clickthrough rates
- poor conversion rate from paid traffic
How can you reduce your customer acquisition cost? The easiest way to do it is to solve your conversion rate — and I've already told you how to solve your conversion rate, which is to break that metric down.
So first find the problem.
There are multiple quick fixes, such as retargeting — figuring out: if you've already spent on acquiring a customer in terms of traffic, make sure you get their email. Extremely important. Because you've already got them. Get a micro conversion. Forget about the conversion — get a micro conversion. And then retarget them with a phenomenally personalized email. Solve all their problems. Try and get them back.
Metric 9: Return on Ad Spend (ROAS) — A Targeting Problem, Not a Page Problem
And that brings me to return on ad spend.
This metric is significantly easier to solve if you solve your ad targeting compared to solving your conversion rate. More often than not, I see businesses saying, “Hey, here is the landing page I'm sending all of my paid traffic to, and it's the landing page that's not converting.”
I'm sorry to say, but that's not the right way to look at it.
The right way — or at least the way I would recommend you look at it — is to first ask:
- Is this traffic interested in what I'm selling?
- Do they have this problem?
- How much of this traffic is giving me those 47 seconds?
- And in those 47 seconds, am I communicating what I need to communicate?
That's the simple line of questioning you need to put your business through.
Then you track your ROAS, make changes, plot this ROAS on a week-to-week basis — make your agency do that if the agency manages ads for you — and then see if it improves or not.
Generally speaking — and I'm going to put this candidly — the last three times that a client has reached out saying, “Hey Shashank, I attended your webinar, I wanted you to take a look at my Google Ads if you can just spend two minutes on it,” and I'm always glad to oblige — but generally speaking, I've seen Google agencies running Performance Max campaigns, no keywords, no optimization, just running the campaign. So there is really nothing that the agency is actually even doing.
I feel you've got to be a little bit more curious with your data, with your ROAS. I know your life depends on it. You know your life depends on it. I feel there's a lot inside of that.
Metric 10: Checkout Abandonment — The Most Painful Drop-Off
We are at our last three metrics. The first one is checkout abandonment — the most painful thing.
This is when you got into Walmart, picked 30 products you wanted to buy, went to the cash counter, and left your trolley. And so it's the most painful.
Generally speaking, checkout abandonments originate in the most deep-rooted fears:
- lack of trust
- or missing information while the user is reaching checkout
Example:
- hidden shipping costs
- frustratingly long account creation
- confusing checkout
- missing trust signals
- missing return policy
- unclear shipping timelines
In most cases, we are not talking about how the product has a 30-day return on the checkout page. And also, I can completely empathize with you — if you're on Shopify and they don't allow you to even leverage the checkout design. But you have the cart, you have the product page to fix that.
Are people reaching checkout before they have all the information? Because in a lot of cases, what we figure out is that users go as far as the checkout to first answer their questions:
- “When is it going to reach me?”
- “How much is it going to cost to reach me?”
These two questions are generally answered in checkout. And so when they find answers to those questions, they abandon.
Can you answer them earlier? And can you justify those answers earlier? Because the checkout is not going to do the justification for you. It's not going to make sure people understand why you're charging 20 bucks for shipping:
“Because you have organic packaging.”
“Because it’s break-proof.”
“Because if it breaks, you get your money back.”
Whatever your justification is — communicate that before the checkout, so they don’t go there just to get answers and leave.
Metric 11: Retention — Why Customers Don’t Come Back
Moving on, we go to retention. This is another huge one. How good are you as a business at retaining customers? And what stops you from retaining them?
If your product is the problem, then of course solve that. But from a conversion rate optimization lens, it could be:
- effectiveness of your targeting
- personalization inside your emails
- personalization inside your ads
- personalization on the store
- customers finding better deals or prices elsewhere
The number one reason I've seen health supplement brands, some fashion brands, and people selling general everyday equipment lose customers is this:
They come and make the first purchase on the DTC site, and the second purchase on Amazon — because Amazon ships faster. And they will switch brands or switch vendors in the interest of shipping.
So if you've given them a reason big enough in their first purchase to make the second purchase from you, your retention would automatically be solved for.
So what is it that would make them choose you the second time after buying from you the first time?
Offers and discounts are the obvious one. But is there any other reason they would choose you?
- Better support
- Faster shipping
- A personalized recommendation
- A replenishment reminder
- A subscription
- A VIP perk
- A loyalty benefit
- A “we understand your usage cycle” moment
That's something to think about. You have to solve that for your product.
Metric 12: Post-Purchase Email Click-Through Rate — The Most Underused Opportunity
Post-purchase email click-through rate — now I feel the number one thing that businesses end up not doing is using the order confirmation email itself as an opportunity to sell.
Because you've just got this committed customer who's not realized the value of your product yet, but they trust you. And so there is a strong case for you to tell them:
“Hey, here is another thing. You've already finished that, but here's another thing you can do.”
Convertcart, for example, is very soon launching a product purely for post-purchase and order-completion emails, which converts your transactional emails into another sales channel. So we would love for you to come and try it with us. Please reach out to me after the webinar — I'm going to send you an email if you want us to try that with you.
But generally speaking, I feel post-purchase experience is not as actively solved for as first-purchase experience.
There is a lot of:
- cart abandonment
- browse abandonment
- search abandonment
…but there is no retention flow that is purely focused on post-purchase.
It’s generally very template-driven.
We generally set up multiple retention flows which focus on making sure the value prop is extremely actively communicated, for cross-sells and upsells, and everything else that you can do.
If you are a product that has replenishment as an angle, subscription is amazing. And you can actually do subscriptions in so many creative ways that it's not even a joke.
I have a friend who's building this company called Loop — they do subscription payment management — and you know what, I'm going to send you some examples of that after the webinar. And I feel it's going to add a lot of value if you are a product that people can subscribe to.
Those are the top 12 metrics that I wanted to talk about today.
I want to focus again on changing your perspective instead of changing your perception.
I'm sure, and I'm confident that this is not the first time you've seen these metrics. If they are, congratulations — you’re now on the same page as most people. But I hope it has changed the way you see these metrics. If it has, let me know.
Additional Important Metrics (Bonus Section Before Q&A)
As an aside, I'm open to taking questions. While you put your questions in the chat or in the Q&A box, if you have any questions, I'm going to just walk you through four or five more metrics that I haven't detailed but I still feel are important to track.
The first is
a) Customer lifetime value.
This means: if you acquire a customer in 2020, how much money are they likely to spend with you over a period of time? And you can calculate that.
So if your cost of acquisition of a customer is $30, and they came and bought a $50 t-shirt from you, and then they bought something else again 8 months later, and then something else again 6 months later — those three purchases make their lifetime value. You can calculate it over a period of two years or three years.
And that tells you that for every dollar spent on marketing and a customer acquired, how much dollar value do you acquire for the future.
That gives you a lot more confidence on spending more money on marketing because it would essentially mean: “Hey, for every dollar I spend, I get back $8,” as opposed to my ROAS of three — because that three is only the first transaction.
That person is going to go and buy three more times in the next two years. So it's still worth your while to acquire that customer slightly more expensively, if your LTV is high.
As a matter of fact, I've spoken to so many venture capitalists and angel investors for e-commerce businesses — they would happily invest in a business that has high ROAS or low ROAS or high cost of acquisition if the LTV is strong.
This CAC:LTV ratio is very, very important. It’s also called “quick ratio.”
In addition to that:
b) Landing page conversion rate
This does not mean “conversion rate of your landing pages.” It means the conversion rate of all the pages on which traffic generally lands.
We often see businesses where there are pages that have a lot of traction. Like we have a jeweler client that sells Wolverine’s blades which are diamond-studded — you can essentially wear it on your hand. These are white gold–plated blades with diamonds on them. It’s obnoxious. And that product gets a lot of traffic because it's meme material — but it doesn’t get any conversions. Because nobody wants that.
So you've got to look at where your traffic is going versus what is really selling, and then try and reconfigure.
c) Gross margin vs. cost of acquisition
How profitable is each marketing dollar for you? There is ROAS, which is revenue. But how much profit does each dollar spent get you? Because if a dollar spent gets you a dollar in profit back — you know what that means.
d) Time to value
Another big one for Convertcart. Our time to value is 50 days. Generally speaking, we want the customer to realize within 50 days that they took the right decision by signing up with us. Essentially, we try and run our first few experiments in the first 14 days. They are successful in the 14–20 days after that, and they see results. So generally speaking, time to value has to be that short. They have to be able to see:
- better search
- better personalization
- or any of the other things that we need to solve on their store
What is it for you? When they place an order and use your product, do they realize value immediately? Or do they realize that value two or three weeks later? Or is it a month later?
We have a client that does kitchen countertops — so the value realization is really delayed. Whereas we also have customers that sell sports equipment — the value realization is as soon as they get it and use it for the first time.
e) Revenue per visitor
Another mega metric that is extremely ignored. It’s your total revenue divided by total visitors. It says a lot about how your business is performing compared to how much traction or eyeballs you’re getting.
And the final one is:
f) Payback period
If you spent $80 in acquiring a customer, how much time does it take for that customer to pay that money back to you? Sometimes you're acquiring customers that are more expensive than the first transaction. It’s very rare, but we have customers that do that.
We have a fishing supply store that sells fishing subscription boxes. Their subscription is $80 a month. Their cost of acquisition is $300. So they don’t break even on that customer for the first four months. But they keep their average customer for 18 months. So they start making profit from the fifth month onwards and continue making it for 18 or 20 months or even more, for as long as the customer stays. And they’re still solving the business and figuring it out.
But that’s something to think about: how much time does it take for the customer to pay your marketing back?
Q&A
I'm open to questions. I'm going to stick around for a few more minutes. Please let me know if you have any questions, thoughts, feedback for me. I hope this was useful. Thank you so much for giving me your time today — about 50 minutes since I've been speaking — and yeah, I'm happy to take questions. So please put them in the chat or in the Q&A, and I'm going to answer them right now.
Interestingly, Zoom doesn't tell me someone’s typing, so I don't know if there's somebody asking questions. But yeah.
Okay, so I have one in. Again, please select “Everyone” when you're asking because then nobody else can see it, and only I can see it.
Question: “Can you calculate some of these metrics inside GA4?”
Answer: Yes. GA4 is very capable. There’s an Explore section which allows you to build reports from scratch. But it can only build reports for the events that you throw into it. So you’ve got to configure it extremely well first. If it is configured super well, then you can start tracking some of those metrics. You obviously can't track stuff that is not captured inside GA4. But revenue per visitor, that kind of stuff, is very easy to build inside GA4 and continue to track.
Question: “What are the scope of pricing options for conversion rate optimization?”
Douglas, I'm happy to reach out and walk you through some of that information. We'll also, in fact, do a free audit if you'd like. In fact, we would like to offer that to everyone — if you want us to analyze your site, do a free audit, understand what stuff works, what doesn't, and even get into your GA and look at some of these metrics, we're happy to do that.
Sometimes getting a third-person perspective is priceless. You look at your site too many times, and you're likely to lose the ability to differentiate between stuff that works and stuff that doesn't work.
Thanks so much everyone for your time. I hope this was valuable. Have a fantastic rest of your week and a phenomenal weekend, and I'll see you in the next webinar.
Thank you.
Get Fresh ideas to boost your conversion rate
(stuff that works for hundreds of stores)
Request a Free Site Audit"Convertcart’s Audit Report was deep and insightful. We never thought they would spend so much time in building and sharing such insightful content, free of cost."


Logan Christopher
Lost Empire Herbs