The range above, from 3.23% for luxury to 13.14% for food and beverage, tells you something important: the add-to-cart rate is not a universal number; it is a category-specific signal.
A luxury jewellery brand at 4% is likely outperforming its sector.
A food brand at 4% has a serious problem. The habit of comparing against a blended global average of 6% is, at best, useless. At worst, it is actively misleading.
Seasonality compounds the confusion further. Add-to-cart rates peak in November, hitting roughly 7.5% globally during the BFCM window and trough in summer.
A brand comparing its August numbers against a November benchmark is not benchmarking. It is confusing itself.
2. What High-Revenue Brands Do Differently: Desire Before the Cart
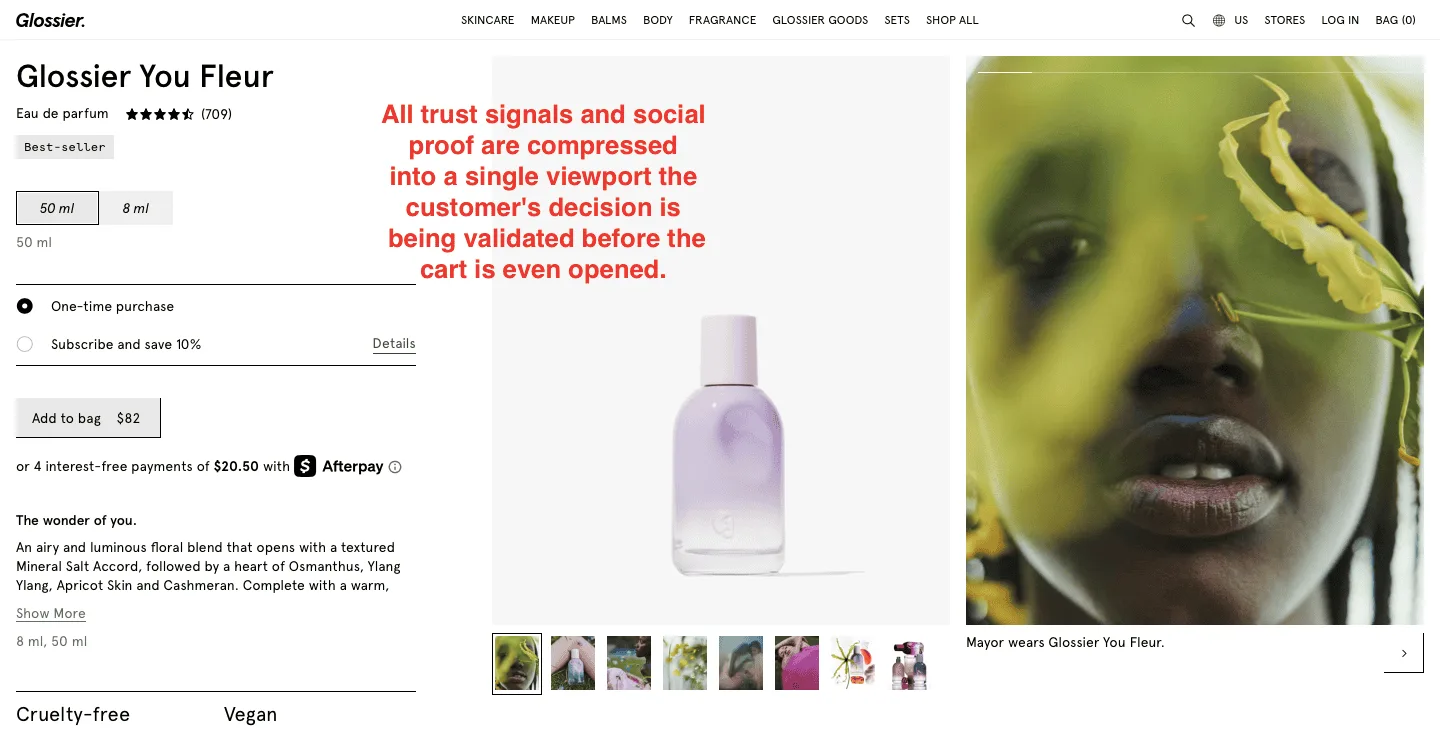
Consider how Glossier built its first decade of growth.
Their product pages are not remarkable by conventional CRO standards. The buttons are unexceptional. The layouts are clean but not revolutionary.
What is remarkable is that a significant portion of their customers have already decided to buy before they arrive on the page because the brand has spent years building a wanting through community, content, earned media, and a carefully maintained aesthetic identity that makes their customers feel something.
The same is true of Skims, Le Labo, and Allbirds in their early years. These brands do not win because their add-to-cart buttons are optimally sized. They win because desire precedes intent, and intent precedes the cart.
By the time a customer opens a product page, the add-to-cart click is almost clerical.
The work was done elsewhere, earlier, and in ways that don't show up on a CRO dashboard.
72%
increase in brand value for CPG companies that pursue brand-equity balanced strategies, versus just 20% for short-term performance-focused brands.
Source: Trace Brand Building / Bain & Company analysis, 2025
This is what the brand-versus-performance debate in eCommerce consistently gets wrong. Brand investment isn't the soft, unmeasurable thing that lives in a separate budget and gets cut first. It is the mechanism that makes performance marketing cheaper and product page optimization meaningful.
Without it, you're asking conversion tactics to compensate for the absence of desire, and conversion tactics are extraordinarily bad at that job.
Product discovery – barriers that prevent shoppers from finding items
Category/collection pages – improvements that drive deeper product exploration
Product page – what to optimize to convert 2–3x more buyers
Cart – ways to ease hesitation and speed up purchase decisions
“The report was deep and super insightful. Can’t believe it’s free.”
Logan Christopher CEO, Empire Herbs
3. The Benchmark Question You Should Actually Be Asking
The benchmark question "What's a good add-to-cart rate?" is actually the wrong question. The right question is: of the visitors who arrive on your product page already wanting your product, what percentage fail to add it to their cart?
That number, the friction rate among high-intent visitors, is the one that tells you whether you have a mechanics problem.
Everything else is a desire problem, a trust problem, or a traffic quality problem, and none of those have product page solutions.
Most stores don't know this number because they don't segment by intent. They look at aggregate add-to-cart rates across all traffic branded search visitors sitting alongside cold social traffic, returning customers alongside first-time arrivals, and try to draw conclusions.
It's the analytical equivalent of averaging the exam scores of students who studied with those who didn't attend class, and then wondering why the tutoring program isn't working.
A 6% add-to-cart rate doesn't tell you that 94% of visitors chose not to buy. It tells you that 94% of sessions didn't result in a cart addition, and those are very different problems.
4. A Diagnostic Framework: How to Use Add-to-Cart Data Without Being Misled By It
The practical implication is a diagnostic shift, not a tactical one. Before running another A/B test on your product page, ask three questions.
First: What is the add-to-cart rate specifically for visitors arriving via branded search? This is your highest-intent cohort: people who typed your brand name.
If they're not adding to cart, you have a product page problem worth fixing.
Second: What is the add-to-cart rate for first-time visitors arriving via cold paid traffic? If this is low, you likely have a desire or trust gap that no amount of button optimization will close.
Third: What is the cart abandonment rate after add-to-cart? If people add items and then leave, the problem is downstream: pricing, checkout friction, shipping costs, and has nothing to do with your product page at all.
These three numbers will tell you more in five minutes than a month of aggregate benchmarking. They will also tell you something uncomfortable: that the levers most worth pulling may not be on your product page at all.
They may be in your email program, your content strategy, your returns policy, your influencer relationships, or the three-year investment in being a brand people actually want to buy from.
None of that is as satisfying as a clean A/B test result. It's harder to defend in a quarterly review. It requires someone in the room who is willing to argue for things that don't show up on a dashboard within 90 days.
But it's the work. And the stores that look back on this period as the one where they pulled away from the competition won't have cracked the optimal add-to-cart button.
They'll have stopped treating desire as something that happens on a product page, and started treating it as something you build slowly, deliberately, long before the cart is ever opened.


![eCommerce Add-to-Cart Benchmarks: Why Micro-Conversions Distort Revenue [Industry Data]](https://cdn.prod.website-files.com/605826c62e8de87de744596e/69b945adb7257fcd4bd28561_1.png)


.avif)
.svg)

.svg)

.svg)
.svg)
