Convertcart insight: Fixing an upstream problem almost always improves downstream metrics automatically. Don't jump to checkout fixes if your product view rate is where things are going wrong first.
STEP 3: What changed?
Sub-step
What to Do
Details / Checks
Outcome
3A. Review changes before drop
Check the timeframe before declining
Internal: Website updates, pricing, shipping policies, new scripts. Traffic: New campaigns, audience changes, traffic mix. External: Seasonality, competitors, economy.
Once you’ve identified where the drop begins, the next step is mapping that stage to its most likely cause so you fix the root, not the symptom.
The Conversion Drop-Off Map (Stage > Cause > Fix)
Funnel Stage
The Symptom
Primary Culprit
The Scientific Fix
Top of Funnel (Ads to Site)
High Traffic, but Bounce Rate spiked by 20% plus
Intent Mismatch
Audit recent ad creative changes. Does the landing page headline match the ad promise?
Middle of Funnel (Product Page)
High Views, but Add to Cart rate dropped
Confidence Friction
Check for missing trust signals, broken image zooms, or sudden Out of Stock on top SKUs.
Bottom of Funnel (Cart Page)
High Add-to-Carts, but Checkout starts dropped
Cost Transparency
Are shipping costs or taxes hidden until the very end? Move the shipping calculator upstream.
The Finish Line (Checkout)
High Checkout starts, but 0% Completion
Technical Break
Test the Pay button on iOS/Safari. Most 100% drops are technical, not psychological.
Segment Specific
Conversion dropped only on Mobile
Effort Friction
Run a speed test. A 1-second delay in mobile load time can drop conversions by 7%.
Note Before Diagnosis
Since January 2026, many merchants have seen click-through rates fall due to AI Overviews absorbing answers. This means fewer but more qualified visitors, which can cause CR to look lower in isolation. If CTR falls but on-site CR (sessions to transactions) is stable, it is an AIO problem, not a conversion problem.
Once you’ve identified where the drop begins, you’ve narrowed the problem but not solved it.
Each stage of the funnel can break for multiple reasons, and surface-level symptoms often hide deeper causes.
The next step is to move from stage-level diagnosis to layer-level analysis: identifying the exact friction point that’s suppressing conversions.
The 10-Layer Conversion Rate Diagnosis Stack
Layer 1: Traffic Quality and Acquisition
The problem at this layer: wrong people or wrong expectations coming in. A funnel can only convert the visitors it receives.
1. High Homepage Bounce Rate
The Problem
Visitors arrive at your homepage and leave without exploring further, not because they dislike your products, but because the page fails to give them a compelling reason to stay.
Why It Happens
Clumsy navigation, unclear value propositions, and poor content hierarchy all combine to deprive shoppers of the orientation they need. A homepage that doesn't immediately answer "what is this store, who is it for, and why should I care?" is one that loses visitors in the first few seconds.
How to Fix It
Make your search bar prominent and always visible, not tucked behind an icon. Add auto-suggestions that surface categories alongside product results.
Feature social proof contextually: a single review snippet near a product recommendation outperforms a generic review carousel that visitors scroll past without reading.
Communicate your value proposition in the hero section, not buried below the fold. Visitors shouldn't have to scroll to understand what you sell and why it matters.
Reduce navigation complexity. If your top menu has more than seven items, you're asking visitors to make too many decisions before they've committed to anything.
Metrics to Watch
Bounce rate (homepage) — benchmark against your historical average, not industry averages
Average session duration on homepage
Click-through rate from homepage to category or product pages
Scroll depth on homepage — how far are visitors getting before leaving?
⚠️
Want to know why high-intent shoppers still abandon your store?
Product discovery – barriers that prevent shoppers from finding items
Category/collection pages – improvements that drive deeper product exploration
Product page – what to optimize to convert 2–3x more buyers
Cart – ways to ease hesitation and speed up purchase decisions
“The report was deep and super insightful. Can’t believe it’s free.”
Logan Christopher CEO, Empire Herbs
2. Undifferentiated Branding
The Problem
Your store looks and sounds like every other store in your category. Visitors can't immediately articulate why they should buy from you rather than a competitor.
Why It Happens
Stores that compete purely on discounts, with no distinctive positioning, attract bargain hunters who rarely convert at full price and a few customers who convert from brand loyalty. A missing or vague UVP (unique value proposition) is invisible in normal conditions and catastrophic when a competitor launches a promotion.
How to Fix It
Audit your reviews, support queries, and social comments for recurring phrases about how your products have improved customers' lives. That language is your positioning; use it verbatim.
Create an origin story that explains why your brand exists and what you believe about your category. The best eCommerce brands don't just sell things; they hold a point of view.
Reposition your hero section and category page banners around pain points solved, not product features listed. "Sleep better in a week" converts better than "premium bamboo pillow."
Metrics to Watch
Direct traffic and branded search volume a proxy for brand recall
Return visitor rate customers who remember you come back
Conversion rate for new visitors vs returning visitors — a widening gap signals a weak brand impression
Email subscriber growth rate, brand affinity drives people to opt in
3. Sending High-Intent Visitors to the Wrong Pages
The Problem
Shoppers who arrive via a specific product recommendation from an email, ad, or social post land on a generic category page or the homepage, and have to search for the product they were already primed to buy.
Why It Happens
This happens when campaign URLs aren't maintained carefully, when recommendation logic in email platforms defaults to category-level links, or when product URLs change during a site migration without redirect updates. The shopper was ready. The routing let them down.
How to Fix It
Audit your highest-traffic external links, ads, emails, and social posts, and verify that every one lands on the correct destination page. Do this after every campaign build and every site update.
Review your recommendation email platform's link logic. Product-specific emails should link to product pages, not category pages.
Set up redirect monitoring after any site migration or URL restructure. Broken destination pages don't always trigger obvious errors; they just quietly convert at zero.
Metrics to Watch
Landing page bounce rate segmented by traffic source, a high bounce on email traffic is a routing problem, not a product problem
Pages per session for visitors from specific campaigns
Conversion rate by traffic source, large gaps between sources often indicate landing page mismatches
4. Poor Ad Targeting
The Problem
Your ads are reaching a large audience but converting a small one. Traffic volumes look healthy in your dashboard; conversion rates do not reflect that optimism.
Why It Happens
Most websites have an organic audience and a buying audience, and these two groups are not always the same people. Broad interest-based targeting generates clicks from people who are curious rather than intent-driven. When these visitors arrive, they behave differently, with higher bounce rates, lower product view rates, minimal add-to-cart activity, and pull your average conversion rate down.
How to Fix It
Build targeting personas from your actual customer data: who has bought from you, at what price point, from which channels, and with what browsing behaviour beforehand. Target look-alikes of buyers, not look-alikes of visitors.
Audit your ad creative for intent signals. Ads that lead with brand purpose and specific product benefits attract more qualified clicks than ads that lead with urgency and discounts.
Segment your ad reporting by audience cohort. If broad audiences are converting at 0.3% and retargeting audiences at 3%, you're averaging together two completely different populations.
Metrics to Watch
Conversion rate segmented by traffic source and campaign
Cost per acquisition by audience segment
Bounce rate by paid traffic source — a high bounce rate on paid traffic signals a targeting or message-match problem
Return on ad spend (ROAS) by audience type
5. Poor SEO and Site Visibility
The Problem
Your organic search traffic is declining, or you're attracting visitors whose search queries don't match what you sell. Either way, the conversion rate reflects a traffic quality problem, not a store problem.
Why It Happens
Keyword strategies that haven't been updated in 12+ months stop reflecting how customers currently search for products in your category. Competitors who publish fresh, high-intent content capture the traffic you're not getting. Missing schema markup means your listings appear less informative in search results, reducing click quality.
How to Fix It
Audit your top organic landing pages in Google Search Console. Look for pages with high impressions but low click-through rates. These are usually fixable with better meta titles and descriptions.
Add schema markup to product pages (Product, Review, and Offer types). This enriches your search listings with ratings, prices, and availability, which improves click quality.
Review your navigational structure: clear categories, subcategories, and filter options named the way your customers actually search are both a UX improvement and an SEO signal.
Identify high-intent keywords in your category that you're not currently ranking for and build content around them — buying guides, comparison posts, and category explainers.
Metrics to Watch
Organic sessions and organic conversion rate (separate these from the overall conversion rate)
Google Search Console: click-through rate by page and query
Keyword ranking positions for high-intent commercial terms
Crawl errors and indexed page count in Google Search Console
6. Unoptimised for New Traffic Sources
The Problem
A new channel, a viral TikTok, a press mention, or a podcast appearance sends a surge of visitors who bounce immediately because the site isn't built to welcome them.
Why It Happens
Visitors from new sources often arrive with different levels of brand awareness and different purchase intent from your existing audience. Your site assumes a baseline familiarity that these visitors don't have. They need more context, simpler onboarding, and lower initial commitment thresholds. Without these, they leave and don't return.
How to Fix It
When you launch a meaningful new traffic source, monitor the entry-page behaviour of that cohort specifically. New audiences show their friction points in scroll depth, click patterns, and exit pages.
Build dedicated landing pages for significant new sources, especially influencer campaigns and press features, that provide context for visitors who've never heard of your brand.
Reduce the ask for new visitors: before pushing account creation or high-value purchases, give them a low-commitment way to engage, a quiz, a sample, or a clearly explained first purchase offer.
Metrics to Watch
Bounce rate and conversion rate segmented by referral source
New visitor vs returning visitor conversion rate
Time on site for visitors from new sources vs established sources
Email opt-in rate from new traffic sources — a proxy for whether first impressions are positive
Layer 2: Product Discovery (The Hidden Funnel Stage)
This layer sits between acquisition and consideration and silently bleeds conversion rate. If a visitor can't find a product they'd happily buy, no amount of product page optimisation will save you.
7. Slow Product Discovery
The Problem
Shoppers spend too long looking for the right product and give up before they find it. They don't leave because your products are wrong; they leave because finding the right one felt like too much work.
Why It Happens
Poor internal search, vague category naming, insufficient filtering options, and recommendation widgets that surface irrelevant products all add friction to the discovery process. Time-to-product-view, the time between arriving on site and viewing a relevant product, is a metric most stores don't measure, which is exactly why the problem persists.
How to Fix It
Measure time-to-product-view. If it's high, start by auditing your internal search results; most discovery failures begin there.
Enable image-based search results. The human brain processes images in roughly 13 milliseconds. Text-only search results are slower to scan and less likely to trigger an immediate "that's it" response.
Add smart filters on category pages: sort by concern, use case, or key attribute, not just by price or newness. Filters that match the way shoppers think about the category are more useful than standard e-commerce defaults.
Tag your most helpful reviews to appear first in the review section. A review that answers the question a shopper has right now is a discovery accelerator.
Metrics to Watch
Time-to-product-view (time from site entry to first product page view)
Internal search usage rate: What percentage of visitors use search?
Search-to-product-view conversion rate
Category page exit rate: if visitors leave from category pages without clicking a product, discovery is failing
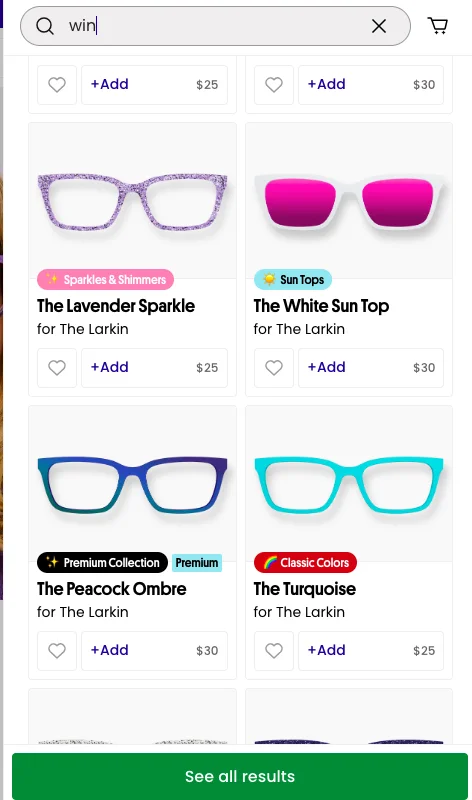
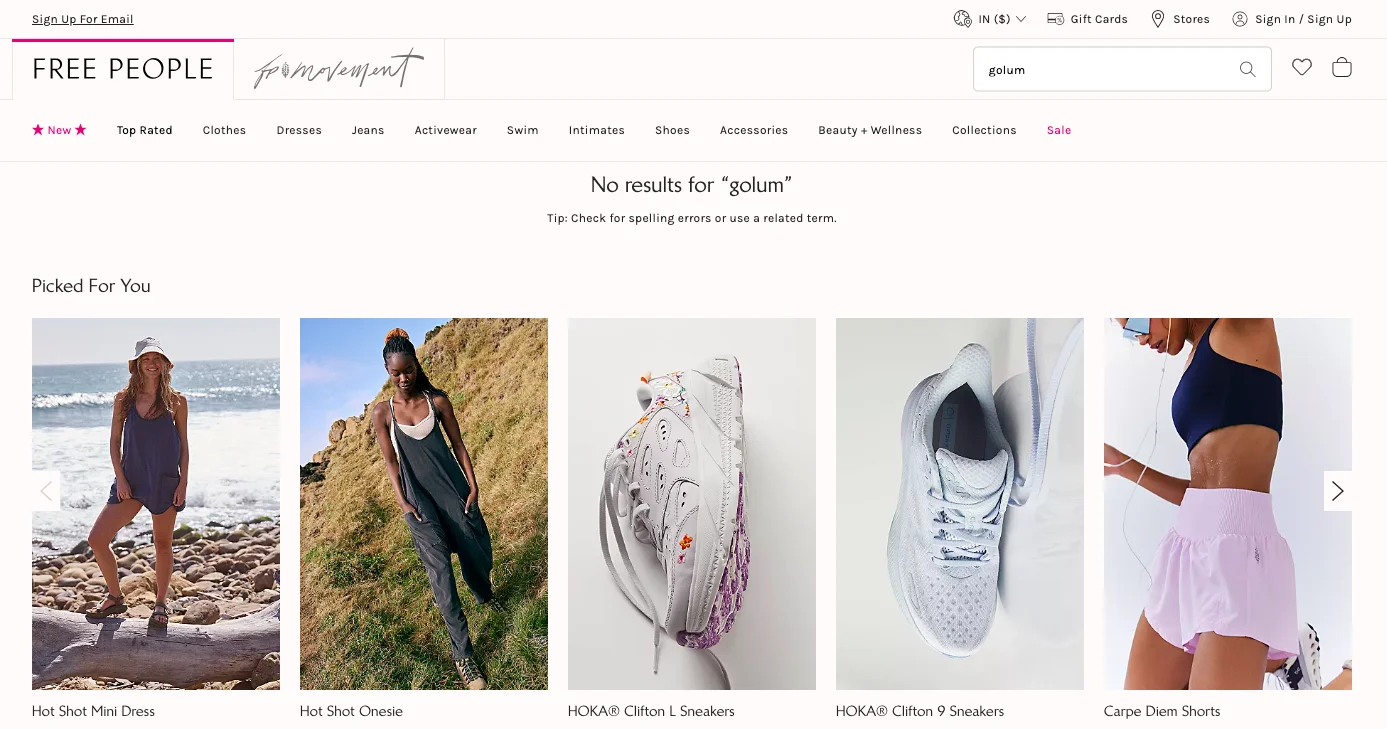
8. "Zero Results" Search Pages
The Problem
A visitor types a product name into your search bar and gets back nothing. The search results page is blank, and the shopper is gone shortly after.
Why It Happens
Zero-results pages happen because product tags don't account for synonyms, common misspellings, or the informal language customers use to describe products. They also spike after inventory changes, a product that was in stock last month no longer exists, but the search query does. Most stores don't monitor their zero-results queries, so the problem quietly compounds.
How to Fix It
Pull a report of your most common zero-results search queries monthly. For each high-frequency query, either fix the tagging on existing products or surface alternative recommendations on the results page.
Add synonym mapping to your search configuration: if customers search "jumper" and you call them "sweaters," the system should know they're the same thing.
Replace blank results pages with a useful fallback: trending products, a prompt to browse a relevant category, or a "can't find it? contact us" prompt. A zero-results page should never be a dead end.
Metrics to Watch
Zero-results search rate (percentage of searches returning no results)
Exit rate from zero-results pages
Most common zero-results queries — this is a product gap and tagging gap diagnostic in one.
Search refinement rate: How often do visitors modify a query after an initial search?
Layer 3: Product Pages and the Consideration Stage
This is where the largest number of conversion problems live. The product page must simultaneously inform, persuade, and reassure someone who can't touch or try the product. When it fails at any one of those three jobs, the add-to-cart rate suffers.
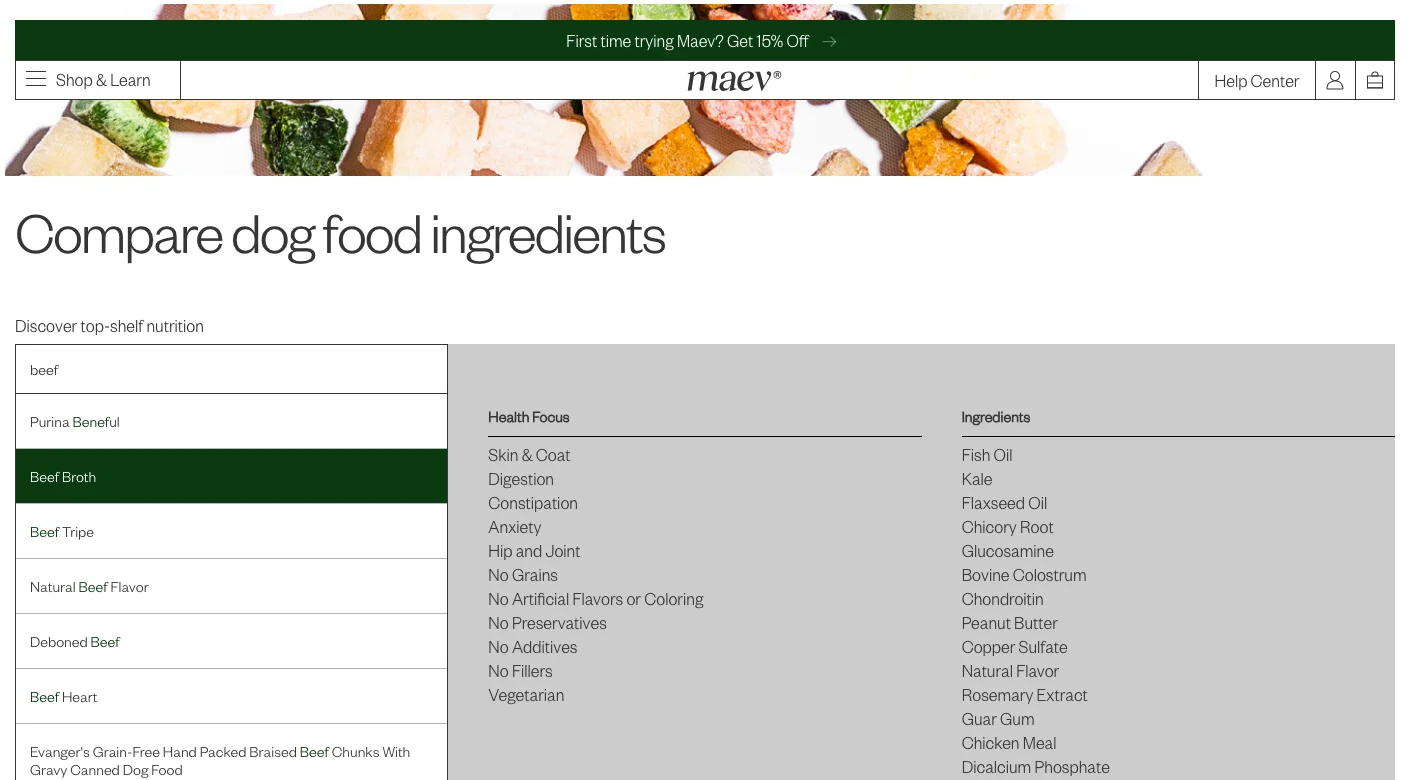
9. Not Enough Product Guidance
The Problem
Shoppers can't quickly understand which product is right for them, how products in your range compare to one another, or what the product will actually do for them in practical terms.
Why It Happens
Product guidance is often confused with product descriptions. But guidance is a broader concept: it encompasses the comparison tools, size guides, use-case explanations, and contextual recommendations that help shoppers self-select the right product without needing to contact support. When these elements are missing, shoppers abandon rather than guess.
How to Fix It
Add short 6–7 word descriptors to every product recommendation that explain its chief function — not its name, its function.
Build a product comparison feature if your catalogue has meaningful differences between products. A well-implemented compare function reduces the cognitive effort of choosing and increases confidence.
Include "best for" labels on product listings: "best for sensitive skin," "best for large spaces," "best starter kit." These guides help shoppers without requiring them to read every description.
Add a quiz or recommendation flow for high-consideration categories where first-time visitors are likely to feel uncertain.
Metrics to Watch
Add-to-cart rate by product, a low rate on specific products often indicates a guidance gap, not a product problem
Support contact rate for questions like "which one should I get" a high rate means guidance is missing on-site
Time on product page before add-to-cart — very short times can indicate confusion as much as confidence
Comparison feature usage rate, if you have one
10. Confusing Product Pages
The Problem
Visitors can't make sense of the product page: descriptions are unclear, trust signals are missing, sizing or variant information is ambiguous, or the information hierarchy requires too much effort to follow.
Why It Happens
Product pages that have grown organically over time tend to accumulate inconsistency: some pages have detailed descriptions, others don't; some have reviews, others haven't been updated in a year. The result is a browsing experience that feels unreliable, and shoppers who don't trust the information on a page don't buy from it.
How to Fix It
Build a checklist of the most common customer objections in your category and verify that every product page addresses each one: fit, quality, ingredients, shipping time, and return policy.
Standardise your information hierarchy across all product pages: product name → price → key benefits → primary CTA → specs → how-to-use → recommendations → reviews → footer. This order reflects the order in which shoppers typically want information.
Add a sticky CTA that follows the visitor as they scroll. Don't make someone scroll back to the top to add something to their cart.
Run a content audit: flag every product page that's missing reviews, size guides, or use-case information and systematically fill the gaps.
Metrics to Watch
Add-to-cart rate by page
Heatmap and scroll depth on product pages: Are visitors reaching key information or abandoning before it?
Exit rate from product pages
Support queries about specific products is a signal that the page isn't answering key questions
11. Too Many Product Options
The Problem
Visitors presented with too many similar products, without clear differentiation between them, do nothing rather than risk making the wrong choice. Choice paralysis is a real and measurable conversion suppressor.
Why It Happens
Adding products increases the theoretical surface area for conversion but decreases the probability that any individual product gets chosen. When your catalogue grows faster than your discovery and guidance infrastructure, the result is a store where everything is available, and nothing is easy to select.
How to Fix It
Highlight bestsellers with clear, unambiguous labels. "Most loved" or "#1 seller" is more actionable than "popular" or "featured."
Attach social proof specifically to the products you most want first-time visitors to consider. A product with 847 five-star reviews shown upfront is less risky to choose than one that looks identical but shows nothing.
Reduce the number of options shown simultaneously in recommendation widgets. Four products presented confidently outperform twelve products presented neutrally.
Use behaviour-based filtering to progressively narrow options as visitors signal their preferences through browsing patterns.
Metrics to Watch
Conversion rate by product identifies if the problem is diffuse across the range or concentrated in specific areas
Product page views per session are very high numbers, suggesting visitors are overwhelmed and searching, not deciding
Return rate after purchasing a high rate on specific products may indicate that shoppers chose the wrong variant due to insufficient guidance
12. Unconvincing Copywriting
The Problem
The words on your product pages don't give shoppers a compelling reason to buy. Benefits are stated vaguely, claims are unsubstantiated, and the language requires more effort to parse than the shopping context allows.
Why It Happens
Generic copy "premium quality," "great value," "perfect for everyday use" fails because it applies to everything and therefore means nothing. Shoppers who skim (which is most shoppers, most of the time) need to be able to extract a clear, specific benefit in the first pass. If the copy doesn't deliver that, it won't convert.
How to Fix It
Replace vague benefit claims with specific, measurable ones. "Keeps you warm" becomes "rated to -15°C." "Long-lasting" becomes "tested to 500 washes."
Back up claims with data from clinical trials, independent tests, or aggregate customer outcomes where available. Specificity builds credibility.
Write at a reading level that doesn't require effort. Short sentences. Common words. Active voice. Test your copy by reading it out loud — if it sounds like a brochure, rewrite it to sound like a knowledgeable friend.
Segment your copy for your primary customer personas. Language that resonates with a 28-year-old athlete buying supplements is different from language that resonates with a 55-year-old buying them for recovery.
Metrics to Watch
Add-to-cart rate on pages where copy has been updated vs unchanged pages
Heatmap engagement on description sections — are visitors reading or ignoring?
Qualitative feedback from post-purchase surveys: "what almost stopped you from buying?" is a copywriting diagnostic
A/B test results on copy variants
13. Weak Mobile CTAs
The Problem
On mobile, the primary call-to-action is difficult to tap, disappears after scrolling, or sits in a position that results in accidental taps on adjacent elements rather than the intended action.
Why It Happens
Mobile browsing accounts for the majority of eCommerce traffic at most stores, and yet product pages are frequently designed and tested on desktop. The result is CTAs that look fine on a 1440px monitor and are functionally broken on a 390px iPhone screen too small to tap accurately, positioned where the thumb doesn't naturally land, or hidden after a single scroll.
How to Fix It
Centre-align CTAs and keep them visible at all times, either as a sticky element at the bottom of the screen or as a button that reappears after a defined scroll distance.
Make tap targets at least 44x44 pixels (Apple's minimum recommendation). Smaller than this, and mis-taps become common.
Test your mobile CTA layout on actual devices, not just browser emulators. The way touch events behave on real hardware is not always replicated in developer tools.
Use Google's Mobile-Friendly Test and Core Web Vitals to identify usability issues. Session replay tools like Hotjar reveal exactly where mobile users are tapping incorrectly.
Metrics to Watch
Mobile conversion rate vs desktop conversion rate — a large gap often indicates mobile UX problems
Mobile add-to-cart rate
Tap accuracy on CTAs (available in some heatmap tools)
Mobile bounce rate on product pages
14. Checking Reviews Feels Like a Task
The Problem
Reviews are present on the site, but don't function as a conversion tool. They're sorted in a way that surfaces unhelpful entries, they don't answer the questions shoppers actually have, or they're buried so far down the page that few visitors reach them.
Why It Happens
Reviews added without any curation strategy tend to cluster at the extremes, one-word five-star entries and detailed negative experiences, neither of which is particularly useful to a potential buyer. When visitors can't quickly scan reviews and extract relevant, credible social proof, the reviews don't do their job.
How to Fix It
Default sort order should be "most helpful," not "most recent." A thoughtful review from eighteen months ago is more useful than a one-word entry from yesterday.
Tag reviews by theme fit, quality, delivery, scent, durability, and let visitors filter by what they care about most.
Add post-purchase review prompts that ask specific questions: "How would you describe the fit?" "Would you recommend this for beginners?" Specific prompts generate specific, useful answers.
Feature a review summary or highlights block near the top of the product page — the two or three things customers mention most positively — so visitors get social proof before they scroll.
Metrics to Watch
Review engagement rate: What percentage of visitors interact with the review section?
Add-to-cart rate on products with reviews vs without
Average review score and review volume by product
Scroll depth to review section if few visitors reach it, move the highlights higher
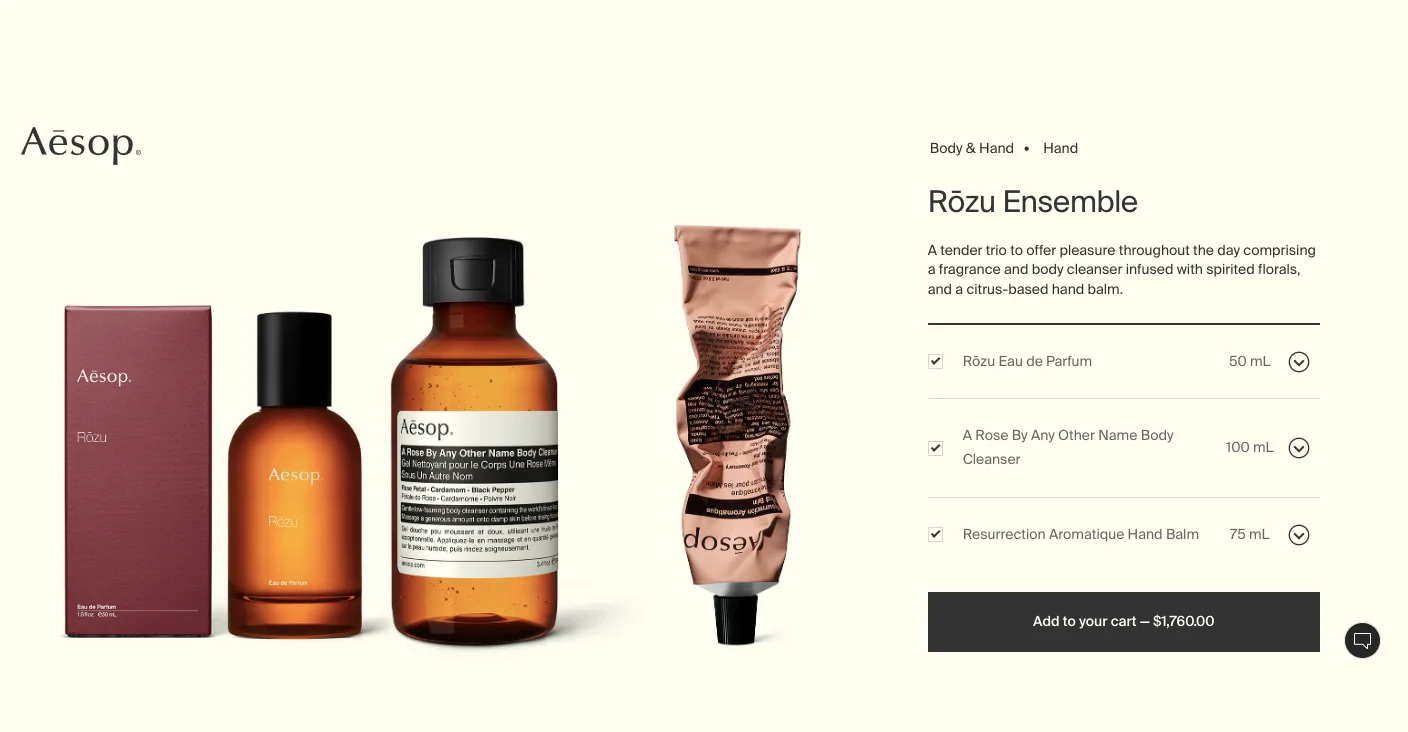
15. Irrelevant or Uninspiring Product Bundles
The Problem
Bundled products sit on product pages and category pages without converting. Shoppers see them, don't find them compelling, and either buy the single item or leave without buying anything.
Why It Happens
Bundles that feel like clearance, assembled from whatever is overstocked rather than from what naturally belongs together, don't create desire. Worse, they can undermine the credibility of the individual products. Bundles work when they solve a specific use case more elegantly than buying items separately. When they don't do that, they're visual noise.
How to Fix It
Define the use case for every bundle explicitly: not "save 15%" but "everything you need to start a skincare routine" or "the weekend kit." A named use case is more persuasive than a percentage discount.
Let customers build their own bundles from a defined option set. This shifts the dynamic from being sold a package to choosing a personalised selection, which is both more engaging and more likely to convert.
Make bundled products individually accessible. Shoppers who want one item from a bundle and can't buy it separately will leave. If they can add it from the bundle view, the bundle view becomes a product discovery tool.
Metrics to Watch
Bundle conversion rate vs individual product conversion rate
Bundle click-through rate: Are visitors engaging with bundle displays at all?
Average order value, effective bundles increase this
Abandonment rate at the bundle display stage
Layer 4: The Cart Stage
Someone who has added a product to their cart has already made a tentative decision to buy. The cart stage is where that decision collides with doubt about cost, about commitment, about whether the process will be easy. The job here is to reduce that doubt without applying pressure.
16. Hidden Costs at Checkout
The Problem
Shoppers reach the checkout page, see their total increase with shipping fees or taxes that weren't visible earlier in the journey, and abandon. The product decision was already made — it's the cost surprise that kills the conversion.
Why It Happens
Research consistently identifies unexpected costs as the primary driver of cart abandonment. Shoppers aren't necessarily unwilling to pay for shipping; they're unwilling to be surprised by it at the point of commitment. Hiding costs until checkout is a short-term display strategy with a long-term conversion cost.
How to Fix It
Show shipping estimates or the full shipping policy on the product page. The cost of fulfilment should never be a surprise.
If you offer free shipping above a threshold, make that threshold visible throughout the site: the hello bar, the category banner, the product page area around the CTA.
Animate cost differences between product variants in real time. When a size upgrade adds to the price, show that clearly. Cost transparency at the product level reduces checkout shock.
Display a shipping cost calculator in the cart before checkout begins — let shoppers see their full cost before they've committed to the checkout flow.
Metrics to Watch
Cart abandonment rate (overall and by device)
Exit rate from the cart page
Checkout start rate — the gap between ATC rate and checkout start rate is often a hidden cost problem
Post-abandonment survey responses, if you collect them: "why didn't you complete your purchase?"
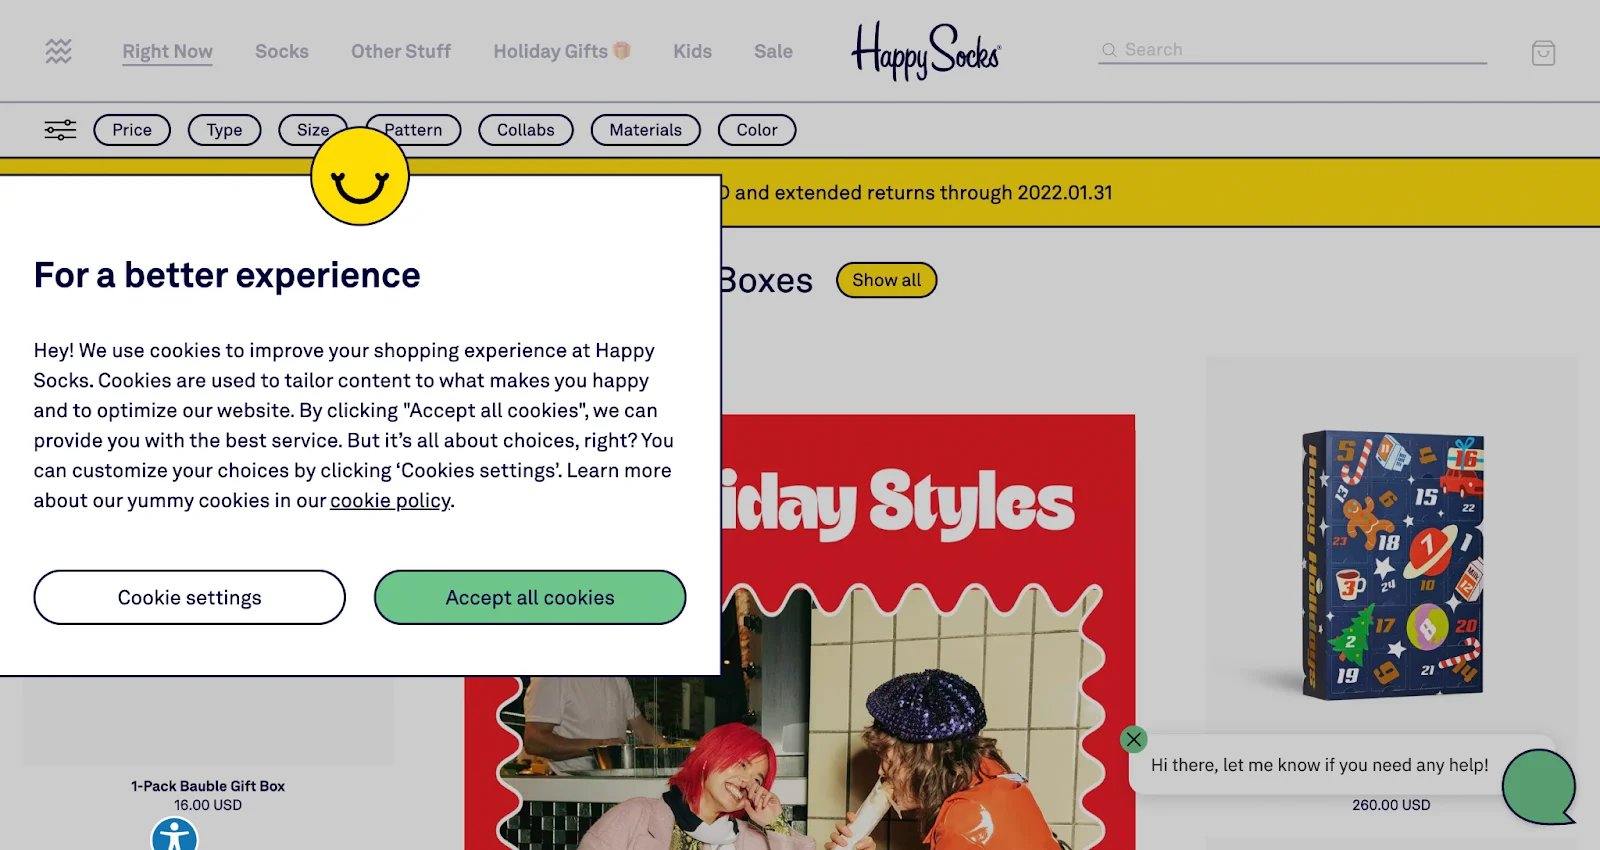
17. Too Many Popups
The Problem
Popups are firing throughout the browsing experience: email capture, discount offer, loyalty programme sign-up, cookie consent, chat prompt — creating an experience that feels like navigating an obstacle course rather than shopping.
Why It Happens
The pop-up problem compounds because each tool that adds a pop-up has its own default settings and its own performance metrics, and no one is looking at the aggregate experience. Individually, each pop-up might seem reasonable; collectively, they're a conversion suppressor.
How to Fix It
Audit the total number of pop-up triggers a new visitor encounters in a single session. If it exceeds two, you have a problem.
Use lightbox popups that dim the background but disappear on a single scroll downward. These interrupt without trapping.
Segment carefully: don't show a first-purchase discount pop-up to someone who is already in checkout. Don't show a loyalty programme pop-up to someone who's been a customer for two years.
Prioritise by impact: if you must choose, the pop-up that captures an email from a visitor who won't buy today is worth more than a pop-up that asks a confirmed buyer to join a programme they're not ready for.
Metrics to Watch
Popup dismissal rate — a very high rate means the popup isn't earning engagement
Conversion rate segmented by visitors who dismissed vs engaged with a pop-up
Bounce rate on pages with the highest pop-up frequency
Email capture rate from pop-up programmes
18. Complicated Return Policy
The Problem
A return policy that is difficult to understand, inconsistent across the store, or restrictive in ways that feel unreasonable functions as a pre-purchase risk signal. Shoppers who anticipate a difficult return are less likely to buy in the first place.
Why It Happens
Return policy problems tend to be legacy issues: policies that were written when the store was small and haven't been updated as the business has grown, different return windows set by different product teams, or fine print that prioritises the store's convenience over the customer's confidence.
How to Fix It
Standardise your return window across the entire store. Different return policies for different product categories create uncertainty, and uncertainty kills conversions.
Offer prepaid return labels. The fear of having to pay to return something that turns out to be wrong is a genuine purchase barrier, particularly for higher-priced items.
During high gift-giving periods (BFCM, Christmas), explicitly communicate any extended return window on the product page and at checkout. Don't assume shoppers will find it.
Put a return policy summary on the product page — not just in the footer. "Free returns within 30 days" displayed near the CTA is a conversion driver, not just a policy disclosure.
Metrics to Watch
Return rate counterintuitively, a clearly communicated, easy return policy often reduces actual returns by reducing purchase anxiety and therefore impulsive or uncertain purchases
Conversion rate on high-value SKUs — these are most sensitive to return policy anxiety
Support queries about returns before purchase — a high rate means the policy isn't visible enough on-site
Cart abandonment rate on products in categories with the most restrictive return policies
Layer 5: Checkout Friction
A shopper who begins a checkout has already decided to buy. This is the point in the funnel where your job is purely to stay out of the way. Friction here is particularly wasteful because it's happening to your highest-intent visitors.
19. Checkout Flow Too Complex
The Problem
The checkout process requires more steps, more decisions, and more data entry than the purchase warrants. Mandatory account creation, redundant form fields, and a lack of express options create enough friction that a meaningful percentage of committed buyers don't complete.
Why It Happens
Checkout flows tend to accumulate complexity over time: a new field added for marketing data here, a required account step added for a loyalty programme there. Each addition seems minor in isolation; together, they create a process that feels disproportionate to the act of buying something.
How to Fix It
Offer guest checkout via OTP as the default low-friction path. Do not make account creation mandatory before purchase.
Add express checkout options, Shop Pay, Apple Pay, Google Pay, and make them prominent, not buried below a long list of form fields.
Reduce form fields to the minimum required to fulfil the order. Billing address, shipping address, payment — everything else is optional or collectable post-purchase.
Make it easy to save a cart for visitors who aren't ready to complete. A "save for later" option on the checkout page — combined with a good abandoned cart email — recovers more revenue than optimising the checkout UI alone.
Drop-off rate by checkout step, which specific step loses the most people?
Form field abandonment rate (available in some analytics setups)
Express checkout usage rate, if it's available but rarely used, it may not be prominent enough
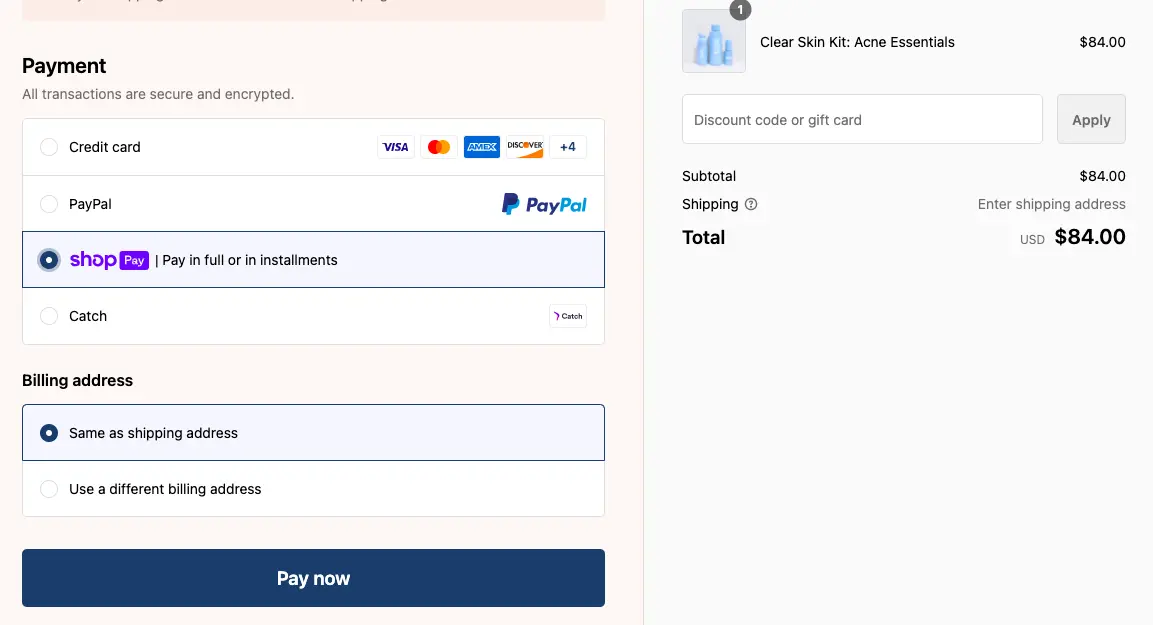
20. Insufficient Payment Options
The Problem
The payment method a visitor expects isn't available, and they don't complete the purchase. This is a conversion block that is entirely avoidable and entirely invisible until you look for it.
Why It Happens
Payment preferences vary significantly by demographic, geography, and purchase type. Mobile shoppers increasingly expect digital wallet options. Younger shoppers are more likely to use BNPL. International visitors may use services that are dominant in their market and unknown to your payment stack. A missing payment method doesn't generate an error; it just generates a closed browser tab.
How to Fix It
Audit which payment methods your existing customers use and what the most popular methods are in your primary markets.
At minimum, offer a major credit/debit option, a digital wallet (PayPal, Apple Pay, or Google Pay), and at least one BNPL option.
For stores with significant international traffic, research payment preferences by market. What's standard in Germany is not necessarily standard in Brazil.
Display accepted payment method icons near the CTA on product pages, not just at checkout. Seeing "we accept Apple Pay" before the checkout reduces friction for those who prefer it.
Metrics to Watch
Payment method usage breakdown: Which methods are actually being used?
Checkout abandonment rate by device type — mobile abandonment often correlates with missing digital wallet options
Conversion rate by geography drops in specific markets may indicate missing local payment methods
Layer 6: Post-Checkout Conversion Blockers
This layer covers the final barriers between a completed checkout and a completed purchase, the things that prevent the transaction from going through, even when the shopper is fully committed.
21. Long or Unclear Shipping Times
The Problem
Shoppers see a shipping estimate that is either much longer than expected or so vague ("ships in 5–10 business days") that it provides no meaningful information. Either outcome reduces purchase confidence.
Why It Happens
Delivery expectations have been calibrated upward by logistics leaders who offer next-day or same-day options. Shoppers who see "7–14 business days" where they expected "2–3 days" don't just choose against express shipping; they sometimes choose against buying at all. Vague timelines are almost as damaging because they shift the uncertainty onto the shopper.
How to Fix It
Be specific about delivery timing: "arrives by Thursday" converts better than "3–5 business days." If your platform supports it, show expected delivery dates based on the visitor's location.
Make express shipping availability and cost visible before checkout, not just at checkout.
If you have a membership programme with faster shipping, show non-members what they're missing — "members get delivery in 2 days; standard is 5–7 days" is a membership conversion prompt and a transparency measure at the same time.
Metrics to Watch
Conversion rate segmented by shipping option selected
Cart abandonment rate on orders where standard shipping is the only visible option
Post-abandonment survey: "was shipping time a factor?" responses
Membership sign-up rate from shipping upsell prompts
22. Technical Failures at Checkout
The Problem
Something breaks: a payment button that doesn't respond on iOS Safari, a coupon field that errors and clears the cart, a checkout page that times out. These failures are rare, but their impact is total a 100% conversion loss for every visitor who encounters them.
Why It Happens
Technical failures are disproportionately likely on iOS/Safari, which handles JavaScript differently from Chrome, and on mobile devices generally, where network conditions vary. They tend to be introduced by deployments that are tested on desktop Chrome and considered done.
How to Fix It
Test your entire checkout flow on multiple devices and browsers on a regular schedule, not just after deployments. Include real devices, not just browser emulators.
Pay particular attention to iOS Safari at every step of checkout: form autofill, payment processing, coupon redemption, and order confirmation.
Set up real-time error monitoring for checkout events using a tool like Sentry. Technical failures should surface within minutes, not in next week's analytics review.
Add a direct fallback at checkout, a visible phone number, or a live chat prompt for shoppers who encounter an error. A failed checkout that results in a phone order is a conversion; a failed checkout with no recovery path is not.
Metrics to Watch
Checkout completion rate by browser and device — Safari/iOS underperformance signals technical issues
JavaScript error rate on checkout pages (via monitoring tools)
Payment failure rate by payment method
Cart recovery rate after checkout errors — are shoppers coming back?
Why visitors don’t trust your store within 3 seconds
Why shoppers can’t find what they’re ready to buy
What’s stopping 2-3x more shoppers from clicking “Add to Cart”
Where buyers hesitate right before purchase
Why high-intent shoppers still drop off
“The report was deep and super insightful. Can’t believe it’s free.”
Logan Christopher CEO, Empire Herbs
Layer 7: Returning Customers and Lifecycle Conversions
A store with strong repeat purchase rates can maintain overall conversion numbers during periods when new customer acquisition is weak. Neglecting the post-purchase experience is a long-term leak that most conversion guides don't cover.
23. Low Number of Returning Customers
The Problem
Customers buy once and don't return. The acquisition cost of each new customer is never amortised across multiple purchases, and the overall conversion rate suffers as the store's customer base is permanently composed of first-time visitors.
Why It Happens
Repeat purchase rates drop for many reasons: poor post-purchase communication, an underwhelming unboxing or delivery experience, no compelling reason to return (no loyalty programme, no new product cadence, no personalised recommendations), but they all point to the same thing: a customer who wasn't sufficiently impressed to come back.
How to Fix It
Treat the post-purchase journey as part of the conversion funnel. Fulfilment updates, feedback requests, and well-timed restock alerts are retention tools dressed as customer service.
Introduce a loyalty programme with a compelling entry point. The best loyalty programmes give first-time buyers an immediate reason to return a points balance they can see and redeem quickly.
Offer pricing and payment flexibility that makes repeat purchasing easier: instalment options, subscription discounts, and subscription-to-standard switches for customers who want the savings without the commitment.
Metrics to Watch
Repeat purchase rate (customers who buy more than once / total customers)
Customer lifetime value by acquisition channel
Time between first and second purchase
Churn rate — what percentage of customers who bought once never return?
24. Generic Email Campaigns
The Problem
Mass email campaigns treat all subscribers as one segment, delivering the same promotions to a lapsed customer, an active browser, and a loyal multi-purchaser. Open rates and click rates decline; unsubscribes increase; the channel loses effectiveness over time.
Why It Happens
A generic email is easy to produce and tempting to over-send. But it trains subscribers to ignore you. A subscriber who opens one in twenty of your emails has effectively lapsed — and the email channel is no longer a useful conversion tool for them.
How to Fix It
Limit sends to no more than two per week as a default. Frequency should be driven by behavioural triggers, such as an abandoned cart, a viewed product, a wishlist update, not by a content calendar that needs to be filled.
Lead with brand narrative and value, not just promotional urgency. The brands that maintain the best email engagement over time are the ones that have given subscribers a reason to look forward to hearing from them.
Develop triggered flows for the high-intent moments: post-purchase, post-browse, post-search, post-abandonment. These convert at multiple times the rate of broadcast campaigns because they arrive when the intent is still warm.
Metrics to Watch
Email open rate and click-through rate by campaign type
Revenue per email sent
Unsubscribe rate is a rising rate, an early warning signal
Conversion rate from triggered flows vs broadcast campaigns
25. Lack of Segmentation
The Problem
Every visitor to your site sees the same content, the same offers, and the same recommendations regardless of their behaviour, history, or intent signals. The site feels impersonal, and impersonal sites convert below their potential.
Why It Happens
Personalisation is a spectrum. At one end is basic segmentation showing different homepage content to first-time visitors vs returning customers. At the other is sophisticated real-time personalisation based on browsing history, purchase behaviour, and micro-cohort modelling. Most stores are much closer to the first-time-visitor end than they realise.
How to Fix It
Start with the highest-leverage segmentation: new visitors vs returning visitors vs existing customers. These three groups have different needs and should see different experiences.
Study intent signals: product page views, search queries, category dwell time. Use these to inform your recommendations in real time.
Apply pricing and discounting strategy at the segment level, not the broadcast level. A shopper who abandoned a £150 purchase twice doesn't need the same 10%-off email you send to everyone — they may need a specific incentive or a risk-reduction nudge.
Metrics to Watch
Conversion rate by visitor segment (new / returning/customer)
Recommendation widget click-through and conversion rate
Revenue per visitor segmented by personalisation cohort
A/B test results comparing personalised vs generic experiences
Layer 8: Technical and UX Issues
These problems don't belong to one funnel stage; they slow everything down. Technical and UX issues are especially treacherous because they're often invisible to the people running the store and painfully obvious to everyone using it.
26. Slow Load Times
The Problem
Pages load slowly, particularly on mobile. Visitors who encounter a slow site don't wait — they leave, and they do so before they've formed any opinion about your products.
Why It Happens
A one-second delay in mobile load time has been measured consistently as a 7% reduction in conversion rate. Stores where key pages take three to four seconds to load on a mid-range mobile device on a 4G connection are losing a significant percentage of potential customers before the session has effectively begun. The problem is almost always driven by uncompressed images, too many third-party scripts, and unoptimised JavaScript.
How to Fix It
Run monthly audits in Google PageSpeed Insights and Core Web Vitals. Focus on your highest-traffic pages: homepage, top category pages, your top product pages, and checkout.
Compress images before uploading. An uncompressed 4MB product image and a 200KB compressed version look identical to a visitor; they do not perform identically.
Audit the third-party scripts running on your site. Every script adds load time. Remove anything you're not actively using, and defer the loading of non-critical scripts.
Lazy-load below-the-fold content. The visitor's first impression comes from what they see immediately; everything below should load as they scroll, not before.
Metrics to Watch
Core Web Vitals scores (LCP, FID, CLS) by page type
Page load time by device type — mobile and desktop often tells different stories
Conversion rate correlation with page speed segments (fast/medium/slow loading sessions)
Bounce rate by page load time bracket
27. Abrupt Website Redesigns
The Problem
A major redesign launches, and conversion rate drops immediately. Loyal customers who've built habits around the old navigation can't find what they're looking for. New visitors encounter a store that hasn't finished establishing trust signals.
Why It Happens
Redesigns are simultaneously necessary and dangerous. The visual and UX improvements they deliver are real. The disruption they cause to returning customer behaviour is also real. Stores that launch redesigns without testing or communication consistently see short-term conversion rate drops — some of which become permanent if customers who were confused don't come back.
How to Fix It
Notify your email subscribers before a redesign launches. Framing it as an improvement and giving them advanced visibility reduces the disorientation of returning to something unfamiliar.
Introduce major structural changes — particularly to navigation and checkout — incrementally, using A/B tests to validate improvements before full deployment.
Monitor the behaviour of returning customers, specifically in the two to four weeks after a redesign. Their confusion patterns reveal which changes caused the most disruption.
Keep a version of your previous navigation accessible (via a "classic view" or similar) for a short transition period during major overhauls.
Metrics to Watch
Conversion rate for returning customers in the weeks immediately following a redesign
Navigation flow changes are returning customers finding products through the same paths?
Support ticket volume spikes after a redesign are a signal that users are confused
A/B test results comparing old vs new designs before full rollout
28. Broken Links and Pages
The Problem
Visitors encounter 404 errors, missing product images, non-functioning filters, or links that go nowhere. The experience feels unreliable, and unreliable experiences don't convert.
Why It Happens
Broken links accumulate silently. A product URL that changed during a migration, an image that was deleted from the CDN, a filter that broke during a theme update — none of these generate alerts unless you're monitoring for them. By the time a customer reports a broken page, it's been broken for weeks.
How to Fix It
Schedule automated crawls using Screaming Frog or a similar tool to catch broken links before customers do. Monthly crawls are a minimum; weekly is better for high-traffic stores.
Add real-user monitoring to catch JavaScript errors that automated crawls miss. A filter that breaks only under certain user interaction sequences won't appear in a crawl.
Make your 404 page functional: a search bar, links to your most popular categories, and a clear path back to the homepage all perform better than a generic error message.
Set up redirect rules for any URL changes immediately. A product that moves to a new URL without a redirect loses its SEO equity and confuses any visitor who arrives via an old link.
Metrics to Watch
404 error rate and the specific URLs generating them
JavaScript error rate on key pages
Filter and search functionality error rate
Organic ranking changes after URL migrations, broken redirects show up in traffic before they show up in crawls
Layer 9: Testing and Optimisation
29. Not Enough Testing
The Problem
Changes to the site are made based on instinct, competitor observation, or best-practice articles without being validated through testing. Improvements are assumed rather than measured. Over time, the cause-and-effect relationship between changes and outcomes becomes impossible to trace.
Why It Happens
Untested changes accumulate. A new homepage banner, a revised product page layout, a different CTA colour, and a simplified checkout step, each change made without a test, represent a permanent unknown. You'll never know if it helped or hurt, and when the conversion rate eventually drops, you have no way to tell which of the dozen recent changes is responsible.
How to Fix It
Establish a testing programme that prioritises by estimated impact and available traffic. High-traffic pages with small conversion rate improvements yield more revenue than low-traffic pages with large improvements.
Run tests long enough to reach statistical significance. Ending tests early, even when one variant is clearly leading, produces misleading results that can cause you to deploy a change that was only winning due to chance.
Keep a testing log: what was tested, when, against what hypothesis, and what the outcome was. This is one of the most valuable knowledge assets a CRO team can build.
Prioritise product pages and checkout for your first tests. These are where small percentage improvements translate to the most revenue.
Metrics to Watch
Number of active tests running at any time
Test win rate: the percentage of tests that produce a statistically significant improvement
Revenue impact of tests over a rolling period
Time to statistical significance per test signal of whether you have sufficient traffic to run a meaningful testing programme
Layer 10: Tracking and Attribution
30. Tracking Shows Wrong Results
The Problem
Your analytics data is inaccurate. Conversion events are firing incorrectly, attribution is miscrediting channels, or key funnel steps are not being tracked at all. Every analysis built on this data is, to some degree, wrong.
Why It Happens
Tracking issues are the most insidious category of conversion problem because they don't appear as a conversion problem — they appear as data that looks plausible. A store that moved to GA4 without verifying that all conversion events were migrated correctly may be making optimisation decisions on a dataset that is missing 30% of its purchase events. The numbers look consistent; they're just consistently wrong.
How to Fix It
Audit your tracking setup quarterly. Compare GA4 conversion data against your store backend (actual orders). If these numbers diverge by more than a few percentage points, your tracking has a problem.
Verify that all key events — add-to-cart, checkout start, purchase — are firing correctly and consistently across all devices, browsers, and traffic sources.
After any platform migration, theme change, or major app addition, test the entire conversion tracking flow from scratch. Don't assume it carried over correctly.
Set up a simple server-side purchase event as a ground truth. Client-side tracking misses some events due to ad blockers, browser privacy settings, and script loading failures. A server-side purchase event captures them all.
Metrics to Watch
Variance between GA4 conversions and backend orders the primary tracking health metric
Event firing rate for key conversion events (verify via GA4 DebugView or Tag Assistant)
Attribution model comparison: Do different attribution models produce wildly different channel-level results? Large discrepancies indicate tracking gaps.
Data freshness and reporting lag, delayed data can produce apparent drops that are just slow ingestion
Information hierarchy; objection checklist; copy specificity
Good ATC rate, low checkout starts
Layer 4: Cart
Shipping cost visibility, pop-up audit, and return policy prominence
High checkout starts, low completions
Layers 5 and 8
Payment options, form field count, and technical error monitoring
Drop only on mobile
Layers 3 and 8
CTA size and position; page speed; mobile UX replay
Drop without an obvious cause
Layer 10: Tracking
Cross-reference backend vs GA4; audit all key events
Gradual decline over months
Layers 7 and 9
Repeat purchase rate; testing programme coverage
New traffic source is not converting
Layers 1 and 2
Landing page relevance; first-visit experience for a new audience
A Final Word
Conversion rate optimisation has a reputation for being about buttons and headlines and the precise shade of orange on a CTA. Some of it is. But the more common failures, the ones that show up consistently across hundreds of store audits, are structural.
They're in the traffic sources, the discovery experience, the information architecture, the checkout flow, and the data layer that underpins all of it.
The discipline here is diagnosis before treatment. Moving quickly through the three-step framework is real. Knowing where it is, what changed will save you the considerable frustration of spending a month redesigning your product pages when the actual problem is a broken GA4 event that's been mislabelling your checkout conversions since March.
Fix the right thing, in the right order. The numbers will follow.
FAQ
What is a normal conversion rate drop?
A drop of 10–15% from your own baseline over a short period is worth investigating, but not panicking over — seasonal fluctuations, a shift in traffic mix, or a single underperforming campaign can all produce this without anything being fundamentally wrong.
A drop of 20–30% sustained over two or more weeks almost always has a traceable cause: a tracking issue, a site change, or a meaningful shift in traffic quality.
The number that matters is never the industry benchmark — it's your own historical average. A store converting at 1.8% that drops to 1.5% is in more trouble than one converting at 4.2% that drops to 3.8%, even though the latter looks worse in absolute terms.
How long does a conversion rate drop usually last?
That depends almost entirely on how quickly the cause is identified and fixed. Drops caused by technical failures can be reversed within hours once caught. Drops caused by traffic quality changes typically take one to three weeks to correct once targeting is adjusted.
The most stubborn drops are structural ones: a redesign that disorients returning customers, or gradual brand erosion compounding over months these can take four to eight weeks to recover and rarely improve without deliberate intervention.
The worst outcome is a drop nobody investigates. Those have a way of becoming the new normal.
Is a 0.5% drop in conversion rate significant?
Almost certainly yes, the math makes it hard to argue otherwise. If your store does $500,000 a month at a 3% conversion rate, dropping to 2.5% costs roughly $83,000 in monthly revenue, assuming traffic stays constant.
Whether it represents a genuine problem or statistical noise depends on your traffic volume and how long the drop has persisted.
On a store with fewer than 5,000 monthly sessions, a 0.5% movement can fall within normal variance. On a store with 50,000 monthly sessions held over three or more weeks, it's a signal worth treating seriously. The most useful question isn't "is 0.5% significant?" — it's "what would this cost us annually if we don't fix it?"


.svg)

.svg)

.svg)
.svg)
