Oops! Something went wrong while submitting the form.
Glossary
A repository of acronyms, jargon, and useful definitions perfect for eCommerce founders & marketers like yourself.
Glossary
>
M
>
Mix Effect
Mix Effect
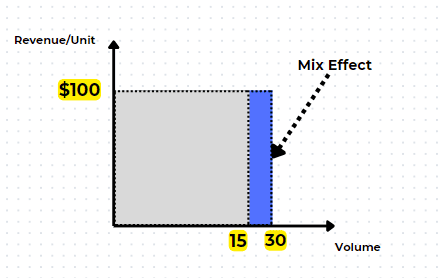
Mix-effect measures the impact on the sales amount resulting from a change in the mix of quantities sold.
With mix-effect, even by keeping the total quantities and prices the same, sales can increase if we sell a higher proportion of expensive products.
It is calculated as the difference between the actual unit and the actual unit at budget price multiplied by the budget price.
For example, if we calculate the mix-effect for any product where the actual unit is 30 and the actual unit at a budget price is 15, then:
Mix effect on quantities 30-15= 15 units.
In this case:
Mix effect= Mix effect on quantities x budget price = 15 x 100 = 1500 EUR
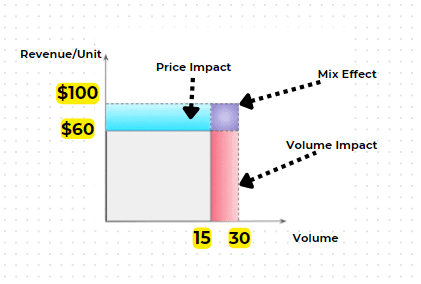
Price Volume Mix Analysis has the following three components
Price Impact (applying higher or lower selling prices per unit)= Target Volume * (Actual price - Target price)
Volume Impact (variation in the number of units sold)= Target Price * (Actual volume - Target volume)
Mix Impact (change in the mix of quantities sold)= (Actual volume - Target volume) * (Actual price - Target price)
Why measure the mix effect?
Diagnostic purpose: Mix effect and price can explain changes in margin and sales
Performance management: If new products or investing in marketing is supposed to improve the mix, then these KPIs can be used to evaluate performance and set the target in advance
Benefits of PVM analysis
Standardizing your Price-Volume-Mix assessment: Tracking the reason for cost increments can be difficult, yet distinguishing causality is critical for your association's drawn-out development. PVM is proposed to assist you with recognizing and conveying the changes to your C-suite associates by empowering you to bore down into the subtleties. In businesses where unstable costs make anticipating profitability harder, you may incorporate a cost bucket and make your PVM assessment on a margin basis
Bridge-building benefits: By identifying and distinguishing the impact of pricing on your revenue or margin and filtering this data by relevant business parameters, you can quantify the adequacy — and inadequacies — of your pricing activities and strategies. The data from the analysis can help you improve your pricing practices and ensure that you are implementing them to get the maximum profit
How To Calculate the Selling Price of a Product From Mix Effect?
Step 1: Calculate the Mix Effect with PVM Analysis:
Use the formula for mix effect: (Actual Units - Target Units) x Budget Price
Analyze it for each product or product category
Identify products with positive and negative mix effects
Example:
Positive mix effect > $1,000: Increase price by 5%
Positive mix effect between $500 and $1,000: Increase price by 3%
Focus on maximizing sales of high-margin products with positive mix effects
Step 4: Analyze Price Sensitivity:
Understand how customers respond to price changes for different products
Use historical data or conduct market research to assess price elasticity
Step 5: Adjust Prices Strategically:
For products with positive mix effects and low price sensitivity: Raise prices to capture more value
For products with negative mix effects and high price sensitivity: Consider lowering prices to stimulate demand
Experiment with bundle offerings or targeted promotions to influence the mix effect
Step 6: Keep The Monitor On:
Track the impact of price changes on revenue, mix effect, and profitability
Adjust prices further based on ongoing analysis and market trends
Use PVM analysis regularly to decompose revenue changes and make informed decisions
Additional Considerations:
Factor in psychological pricing strategies (e.g., charm pricing, price anchoring)
Take good note of competitor pricing and adjust accordingly
Align pricing with inventory levels to avoid stock outs or excess stock
Make sure you don’t adjust pricing based on a category’s mix effect threshold—instead, focus on the mix effect of individual products
Apply appropriate rounding rules to new prices—for example, round up $47.54 to $49.99
Tips For Conducting a Price Volume Mix Analysis
The Blanket Rule: Analyze the variances for each product and timeframe.
Positive values indicate increases in revenue due to that factor (e.g., price increase leading to positive price variance), while negative values indicate decreases.
In case you missed it, PVM Analysis can help find trends and patterns—answer these questions:
“Are certain products driving more price variance”, or are specific periods seeing significant volume or mix effects?
Furthermore, if a product has a high positive price variance, consider raising its price further
Similarly, if another product has negative volume variance, figure out the reasons and adjust its marketing or promotions accordingly
You can further break down the mix variance into “quantity mix” and “price mix” to understand the specific influences within the combined effect
Lastly, PVM can be the make-or-break factor when it comes to price wars
Quick Recap: Easy-to-follow formulas
Mix Effect Formula:
(Actual Units - Target Units) x Budget Price
Price Impact / Price Variance Formula:
(Actual Price - Average Historical Price) x Actual Quantity
Volume Impact / Volume Variance Formula:
(Actual Quantity - Average Historical Quantity) x Average Historical Price
Mix Variance Formula:
Actual Revenue - (Average Historical Quantity x Actual Price)
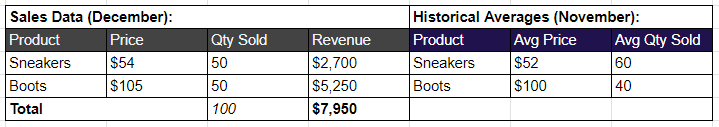
In this example, we have taken two products—Sneakers at $54 MSRP and boots at $105 MSRP.
We'll conduct a PVM analysis for the month of December, comparing it to the historical average prices and volumes from November.
Thus, the PVM Calculations are as follows:
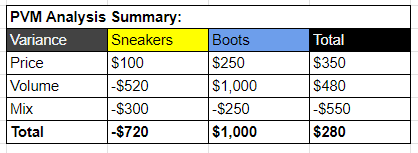
Price Variance:
Sneakers: ($54 - $52) * 50 = $100
Boots: ($105 - $100) * 50 = $250
Total Price Variance: $100 + $250 = $350
Volume Variance:
Sneakers: (50 - 60) * $52 = -$520
Boots: (50 - 40) * $100 = $1,000
Total Volume Variance: -$520 + $1,000 = $480
Mix Variance:
Sneakers: $2,700 - (50 * $54) = -$300
Boots: $5,250 - (50 * $105) = -$250
Total Mix Variance: -$300 - $250 = -$550
Figuring Out The Price Volume Mix Variance Analysis
To calculate profit, we need to consider both revenue and costs. Assuming the cost per unit for sneakers is $30 and for boots is $70, we can calculate:
Total Revenue:
Sneakers: $54 * 50 = $2,700
Boots: $105 * 50 = $5,250
Total Revenue: $2,700 + $5,250 = $7,950
Total Cost:
Sneakers: $30 * 50 = $1,500
Boots: $70 * 50 = $3,500
Total Cost: $1,500 + $3,500 = $5,000
Total Profit:
Total Profit = Total Revenue - Total Cost
Total Profit = $7,950 - $5,000 = $2,950
Calculating Profit From Price Impact / Total Price Variance (TPV):
Formula: TPV = Σ (Actual Price - Average Historical Price) * Actual Quantity
Sneakers: ($54 - $52) * 50 = $100
Boots: ($105 - $100) * 50 = $250
Total Price Variance Profit: $100 + $250 = $350
This means price increases contributed $350 to overall profit.
Calculating Profit From Volume Variance (VVP):
Formula: VVP = Σ (Actual Quantity - Average Historical Quantity) * Average Historical Price
Sneakers: (50 - 60) * $52 = -$600
Boots: (50 - 40) * $100 = $1,000
Total Volume Variance Profit: -$600 + $1,000 = $400
Increased volume for boots contributed $1,000 to profit, but decreased volume for sneakers resulted in a loss of $600, leading to a net gain of $400.
Total Mix Variance Profit: -$300 - $250 = -$550 (matches the provided figure)
The mix variance is negative because the combined effect of price & volume changes for each product resulted in lower revenue than what could have been achieved with simply maintaining historical prices and quantities.
Breakdown of Profit by Variance:
Price Variance Profit: $350
Volume Variance Profit: $400
Mix Variance Profit: -$550
Total Profit: $350 + $400 - $550 = $200
Interpreting The Results
The positive price variance ($350) indicates that price increases contributed to higher revenue
The positive volume variance ($400) suggests that selling more units also boosted revenue
However, the negative mix variance (-$550) means that each product's price and volume changes negatively impacted revenue, suggesting potential shifts in customer preferences or product profitability
While price and volume increases contributed positively to profit, the negative mix effect overshadowed those gains, resulting in a total profit of $200
The store could consider further price increases for boots, as they had a strong positive price variance
Investigate the reasons for the negative mix variance, such as lower-than-expected demand for sneakers or a shift in customer preferences towards boots
Note: These calculations assume a constant cost per unit. For variable costs, adjust the Total Cost formula accordingly.
Thank you. We'll be in your inbox soon 🙂
Oops! Something went wrong while submitting the form.
x
Find fresh (and proven) ways to instantly improve your product page conversions


.svg)

.svg)

.svg)
.svg)