Your first email marketing campaign will tell you which email marketing metrics define success. But you already know that.
But, how do you scale them? That’s what we are here to answer. 😉
Whether this is your first or your hundredth email campaign, we’ve put together a list of the metrics that actually matter – plus some cool, underrated ways to improve them.
But first –
What is the single most important email marketing metric for eCommerce stores?
Most email marketers (and Reddit) chase email ROI, or in simpler terms, profit.
We chase something more sustainable: engagement.
Because profit doesn’t show up out of nowhere.
Profit or ROI in email marketing depends on two things:
How much your emails earn (revenue)
And how much your email marketing costs (tools + team)
But let’s be real—revenue is the trickier half of the equation. And it doesn’t just depend on your list size or your offer.
It’s about how your audience responds. So if you want ROI and email marketing success, here’s the quickest way to stay on track:
Set a SMART goal – specific, measurable, attainable, relevant, time-bound
Pick leading metrics – plan what signals to hit before you start losing money
Monitor coincident metrics – adjust while the campaign is running
Track lagging metrics – see what worked after the dust settles
Now, here’s the kicker: most brands start at the bottom, with revenue and conversions. But that’s too late to fix anything.
15 Key Email Marketing Metrics + How to Improve Them
👉 LEADING METRICS
1. CTOR (Click-to-Open Rate)
What it is: Measures how effective your email content is after it's opened Formula: (Unique Clicks / Opens) × 100 Benchmark: 6 to 17%
🚀 How to improve this email marketing metric:
Make sure your subject line and email copy are in sync – this will give shoppers a reason to keep opening your emails
Design for image-blocking – have HTML-coded buttons, and alt text placed in a layout
Limit the length of your emails – so shoppers don’t get frustrated and bounce off, real quick
Use zig-zag or reverse-pyramid layouts – so eyes naturally glide to the CTA(s)
Place your main CTA above the fold and style it to pop – but tastefully
Use mystery to make shoppers click – like anEaster egg link (“click here for a secret 10% code”)
Animate the CTA – even a simple GIF can draw clicks
Use hooks to make it easy to interact (and click) – like “pick your discount”, “pick your poison”, or “tell us your skin type”
Optimize for mobile UX – like, thumb-friendly CTAs, clear color contrast, and white space to breathe
Avoid slipping in way too many promotions per fold – for example, don’t push your Mother’s day gift guide, right alongside a free shipping for loyalty program members (the goal is to keep it scannable – one idea per sentence, max)
Match email content to buyer type – here's what we mean:
newcomers need storytelling + social proof
Loyalists look for more emotional storytelling
Inject your headlines with value to make shoppers scroll – instead of “Shop 20% off skincare,” say, “The one serum 80% of our fans swear by”
The Catch: Apple’s Mail Privacy Protection fires off image pixels to measure open rates in your emails, which makes your open rate show as much higher than it actually is. Which is why the next most important metric is open rate 👇
2. Open Rate
Definition: % of people who opened your email
Formula: (Unique Opens ÷ Emails Delivered) × 100
Benchmarks:
"Back in Stock" emails = 65.32%
Cart Abandonment = 44.76%
eComm avg = 16.75%
🚀 How to improve this email marketing metric:
Segment your opens by device, time, and location – that 85% open rate might just be iOS blowing smoke (thanks, Apple Mail Privacy Protocol)
Schedule your emails for when they actually will convert – if you’re a food brand, try 4 PM (post-lunch scroll) or 1 PM (pre-lunch slump)
Humanize your sender name – “Jess@ShopCo” beats “ShopCo Weekly Digest” every time.
Use subject lines that tease the value, but not tell – like:
“Psst… it’s back”
“Wait till you see this…”
“We weren’t gonna send this”
Use the preview text to drop hints from your subject line – here's what we mean:
“You’ll hate your <3 for this”
“We almost didn’t send this”
“Weirdly satisfying. Weirdly effective”
Show you value your tribe’s values – “{Influencer} said this last week…” lands better than “New Arrivals Inside” – or you can simply loop in a snippet from a review
Use the names of shoppers to make them feel connected to your emails – like:
Subject: “Jake, this one’s got your name on it”
Preview text: “literally”
Up the FOMO for seasonal products/promotions – say somethinglike“You know what sells out first in May?” (works both ways, even if they know or don’t)
Change the time you show up in their inbox, if they stop engaging – or else, show up consistently at a given time
Pro Tips:
Auto-resend non-opened emails with a different subject line after 36 hours – this way, you don't hit your cadence limits by sending too soon
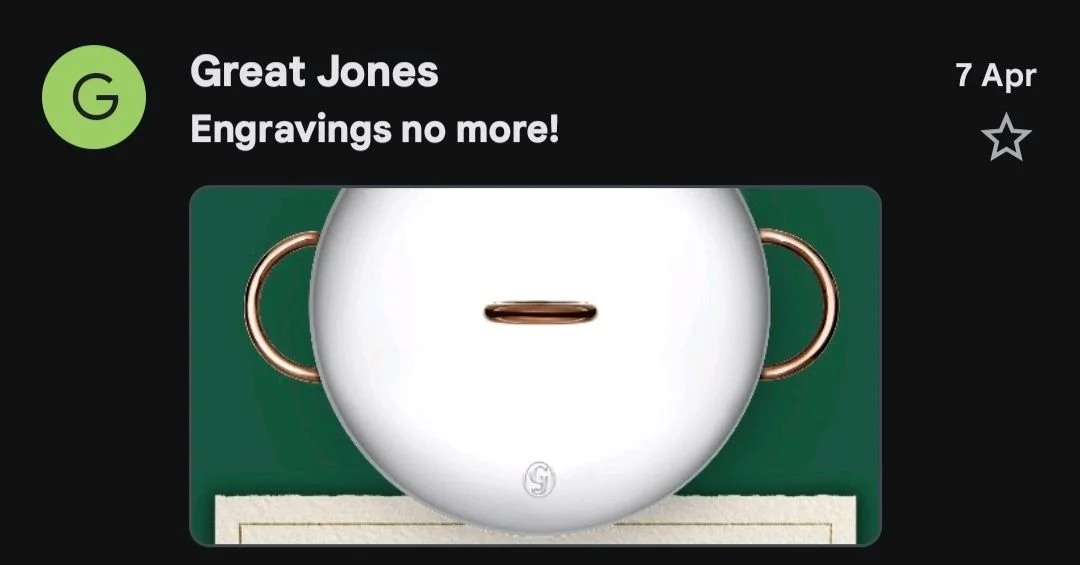
Add schema or structured data to your emails – this will help you create smart previews like this Great Jones’s email and help you jump up your conversion rate (but make sure you actually have link tracking turned on to identify traffic from emails):
What it is: Percentage of total recipients who clicked on any link in your emails
Formula: (Clicks / Emails Delivered) × 100
Benchmark for eCommerce: 2.32%
The Catch: Always lower than CTOR – it’s a bare-bones pulse check of email performance
🚀 How to improve this email marketing metric:
Test visual vs. text-based email formats – sometimes a raw, plain-text wins trust over glossy image-laden grids
Try a curated “founder’s pick” or “last bought by you” – this shows your own expertise and offers personalization
Make the CTAs feel like a next step – like, “Touch here to feel smarter” (weird sells when it feels exclusive)
Put the most important message first – people are in a hurry – the goal of an email is to always get a click
Split emails by signup source – paid leads = skim through scrolls – meanwhile, organic sign-ups look for details
Maintain a ratio to avoid spam, and overpowering the shopper – build contrast, avoid too many messages per fold, and make the design correct (one clear element should stand out)
Feature social media content – yours or from your shoppers (which acts as social proof and UGC)
Pro Tip: The reader has to feel what’s in it for them. Don’t say what you feel – instead, have answers to the question: “so what/why (do I care)?”
4. Time Spent in Email
What it is: Tracks how long subscribers are actively engaging with your email Formula: Avg. time per session (from your ESP or connected analytics tool)
🚀 How to improve this email marketing metric:
Measure time spent on “newsletter” emails vs. “promotional” emails – see which format holds attention longer
Compare dwell time for new vs. repeat subscribers – are your newbies clicking through faster than your VIPs
Add visual anchors every fold – GIFs, motion, or unexpected visuals break the scroll fatigue
Tell a story that features shoppers or people like them – showcase stories from shoppers, achievements, or even before/after formats (people stick around when they see themselves)
5. Conversion Rate
What it is: How many recipients completed a desired action (usually a purchase)
Formula: (Conversions / Emails Delivered) × 100
Benchmark: 1.06% (when calculated against the number of emails sent), 18.54% (for cart abandonment emails)
The Catch: Not all emails convert. This is why, it’s better to calculate conversions per email and overall as part of a campaign
🚀 How to improve this email marketing metric:
Tune in micro-conversions – like “copy code,” “try quiz” “save for later,” or “get price drop alert.”
Use a drip sequence that builds to purchase – email 1: benefit, email 2: use case, email 3: social proof, email 4: final offer
Slow your email cadence if your product has high value (or takes a good amount of consideration) – research shows 2-day cadences convert better than 21, 14, 10, 7, 5, and 3-day cadences
Remove friction from checkout – here’s what we mean
Feature a live chat support
Use one-click reorder or pre-filled carts
Have a BNPL payment option
Pre-fill account details (address, etc.)
Have mobile payment options
Don’t make shoppers sign in
Optimize for mobile viewing (71.5% view emails on mobile)
Auto-apply discount codes via URL parameters
Display visual badges and callouts for returns, shipping speed, and quality
Loop in personalization – “We saw you eyeing X. Here’s X + something else for Y% off” or “We pulled this aside for you. Thought it was your vibe.”
Reduce decision load when recommending products – either feature a maximum of 4 products or ask shoppers to choose – “This or that?” (and build a full drip)
Bundle up offers based on browsing/purchase history – like, “Buy 2, Get 1 suggested just for you”
Nudge at the right time – trigger emails for price drops of browsed or saved items, or back-in-stock items
Offer the right nudges – like a discount on shipping for returning shoppers or extended returns (or extended warranty) for first-time shoppers
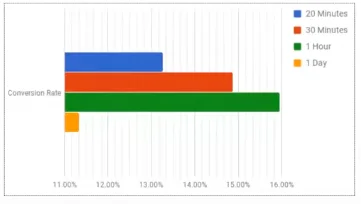
Make sure you send triggered emails in a specific time window – for example, cart abandonment emails perform best, when sent within 1 hour:
Pro Tip: Your subject line → email copy → landing page must tell the same story – or – you’ll lose folks mid-funnel. For example, if the email says “limited time”? – the page better say it, too – with a timer.
What it is: Measures how long shoppers are active on your site after interacting with your email
Formula: Measurable by the number of sessions, and the time on page metric
🚀 How to improve this email marketing metric:
Unlock access to hidden collections – people love to click when they feel they’ve unlocked something others can’t see
Change content blocks based on the subscriber – for example, you can change the banner on lthe anding page, based on the subscriber’s browsing history or location
Run flash access windows – “This collection’s live for the next 90 mins only. After that, it’s gone. Forever”
Ensure that the landing page loads quickly – the first fold should be visible in less than a second (and obviously has to be mobile friendly)
Pro Tip: Always track which part/feature of a page a shopper was looking at when active on site – this will help you personalize the outreach. For example, if a shopper expanded an FAQ, reach out in 24 hrs with a “chat with our support” email.
Need more ideas to increase your time on page?
7. Delivery Rate
What it is: % of emails that actually reached inboxes
Formula: (Delivered Emails / Emails Sent) × 100
Benchmark: 98% for transactional emails, 80% for marketing emails
🚀 How to improve this email marketing metric:
Regularly prune inactive contacts (like monthly at the very least)
Warm up new domains with story-driven welcome series
Validate lists before sending
Limit the number of bulk email campaigns in a month
Don’t buy email lists (ever)
Have DMARC, BIMI, DKIM, SPF, and reverse DNS set up
Maintain a separate subdomain for your email marketing
Get shoppers to save your marketing email in their address book (so you get marked as a recognized sender)
Don’t make your emails way too large in size (less than 1mb at any cost)
Pro Tip: Use time-decay logic. The further they get from their last open, the less often you message them.
8. Bounce Rate
What it is: % of emails that couldn’t be delivered
Formula: (Bounced Emails / Emails Sent) × 100
🚀 How to improve this email marketing metric:
Cross-check email entry forms with autocomplete or AI-based typo correction
Segment out risky or low-engagement segments while sending out large promos
Always keep double opt-in turned on – or feature a captcha check, to filter out bot emails
Make your pop-ups less aggressive – people drop burner emails into pop-ups that scream “GET 15% NOW!!!”
Add MX check logic to lead forms. No MX record = likely a fake email
Prune soft bounces after two occurrences
Pro Tips:
Have a catch-all email set up to improve your reply rate
Filter out non-engaged subscribers (non-openers for Gmail and non-clickers for Apple) – gray mail is a legit concern – it’s also considered one form of bounce and spam
9. Unsubscribe Rate
What it is: Percentage of users who hit the unsubscribe button after receiving an email
Formula: (Unsubscribes / Emails Delivered) × 100
Benchmark: 0.29% (3 unsubscribes max per 1000 emails)
🚀 How to improve this email marketing metric:
Add emotional copy before the unsubscribe CTA (e.g., “We’ll miss you, but…”)
Provide frequency toggles in the footer, not just in the preference center
Swap the hard exit for an opt‑down (“Less often, please!”) so you retain subscribers at a lower frequency
Add a playful note – like, “Ghost us, but we’ll miss you ❤️”
Gamify opens – offer a “Open 3 in a row, unlock this”, or “Vote on what we drop next”
Play with ‘day themes’ –like, Thursday = “wishlist unlocks,” Sunday = “quiet drop” – this trains subscribers to expect (and builds a habit)
Make it feel personal – like a Spotify Wrapped, but for shopping – do a roundup per month in your newsletter
Create a weekly drop – like, style picks, mood matches, even playlists. The more it feels like their feed, the longer they’ll stay tuned in
Introduce surprise senders – like,one-offs from the “product team,” “warehouse crew,” or even the intern, can feel refreshingly real (here’s an example from Shinesty):
Pro Tip: Swoop in with value, not a hard sell. Which is why the idea to curate content through insider tips, trend roundups, or subscriber spotlights works. And, here’s the data:
70% of shoppers (in a Deloitte survey) agreed brands win by integrating into consumers’ culture through “Share of culture” – which means you participate in, reflect, and shape what matters to your people – so they open and engage, week after week
12. Revenue Per Email (RPE)
What it is: Average revenue driven per email sent
Formula: Total revenue ÷ Emails Sent
Benchmark: $0.09 per email campaign, email flows have better value at $1.57
🚀 How to improve this email marketing metric:
Separate revenue from bulk campaigns and revenue from drip campaigns – this will allow you to understand which campaigns drive a bigger chunk of revenue
Calculate which email in your drip campaigns drives the highest conversions and revenue (this’ll also help you modulate your cadence)
Inject scarcity plus relevance in your copy – “Only 9 left in your size” hits harder than “low stock”
Give exclusive access to certain benefits in exchange for order values – “$39 gets you in the club. Free shipping + first dibs all year”
Show excess, but with scarcity – “We made too many. Your price = 25% off till Friday”
Drop mystery bundles – “We’ll pick 3 of your favs. You save 30%”
Use ‘complete the set’ logic to push up your AOV – based on past buys, suggest 1-2 items that “finish the look”
Target the right type of content for browse abandonment, by location – for example:
Feature more product recommendations when a shopper abandons, from a category page
Solve product-related queries or showcase brand benefits when the abandonment occurs on a product page
What it is: Measures how fast your email list is growing or shrinking
Formula: ((New Subs - Unsubs) / Total Subs) × 100
🚀 How to improve this email marketing metric:
Feature sign-up links in your Instagram stories, and link-in-bios – or as a QR code on your packaging – either offer a discount or a fun Easter egg (like see our CEO lose at paintball)
Add a referral challenge (“Invite 3 friends, get 30% off”), gamified with a progress bar
Feature a product recommendation quiz in your notification bar or as a section in your homepage and category pages – with an option to opt in at the end of the flow
Remember: A brand is what gets the shopper to stay, while the product gets the shopper to buy. The average internet user in the US gets to see around 1700 ads per month.
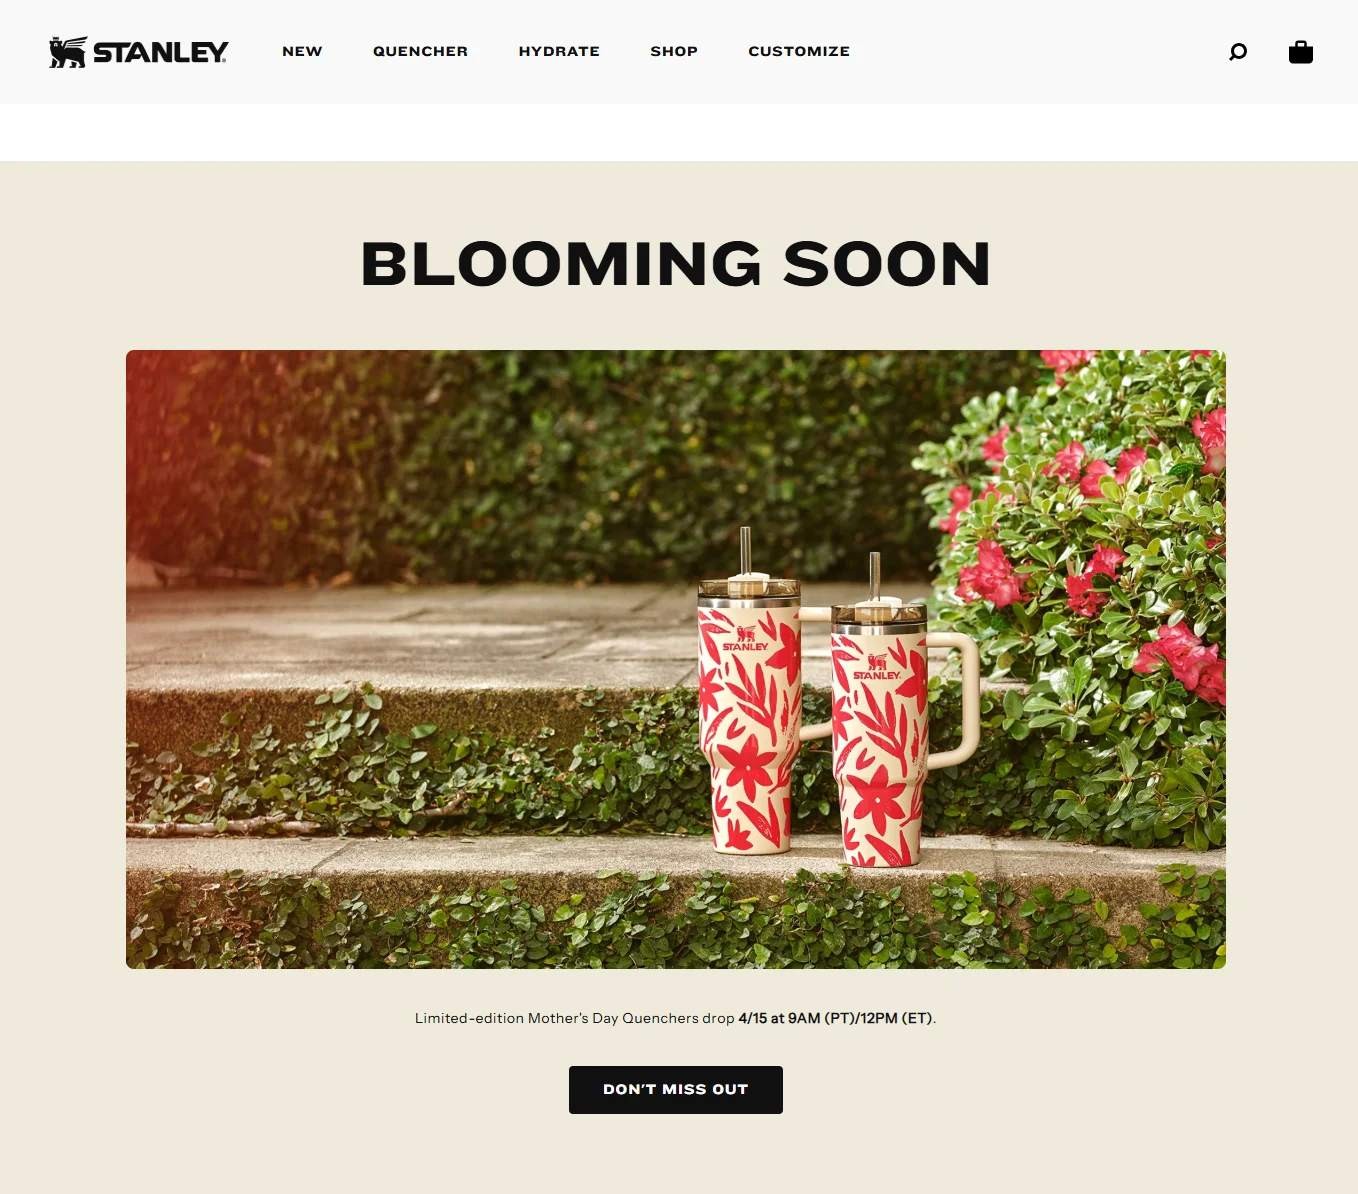
So, if you’re asking them to sign up, you have to provide insane value – like this example from Stanley:
Note how they hype up a pre-order and also tie in the perfect narrative of a Mother’s Day gift. The cherry here? The CTA – “don’t miss out.”
14. Deliverability & Spam Score
What it is: A score that predicts how likely your email is to be marked as spam
Formula: Determined by ESPs based on content, domain rep, sender score
Avoid trigger words AND spammy formatting (like too many exclamation marks or all caps)
Include an actual reply-to address and a human sender name
Use Google's Postmaster Tools to keep close track of your inbox placement rate
Keep your emails super relevant and spaced out – start slow, increase your cadence if a subscriber shows engagement
Pro Tips:
Get obsessive about your reply rate – inbox providers reward actual two-way convo. Drop in a “P.S.: Reply with your biggest struggle with {pain point} for a surprise”
Test your inbox placement every week – across multiple clients, like Gmail, Yahoo, and Apple Mail – check which tab your emails fall into (Primary or Promotions)
15. Subscriber Lifetime Value (SLV)
What it is: The total revenue a customer brings in over their relationship with your brand – attributed to email
Formula: Avg. Order Value × Purchase Frequency × Avg. Duration as Subscribers
🚀 How to improve this email marketing metric:
Tailor your post-purchase drip email sequences to product use cycles – here’s what we mean:
Day 1: “Here’s how to enjoy your {product}” (after delivery)
Day 4 or Day 7: “How’s that {product} treating you”
Day 20: “Leave a review?”
Day 21: Suggest an upsell (for example, “why whey is better than your protein powder”)
Day 30/Product Use complete: “Reorder?”
Personalize retention flows based on lifecycle stage – segment out shoppers by:
When they last shopped
How often they shop
How much they shop ($$$)
Don’t upsell too quickly – personalize post-purchase communication by shopper type – for example, here’s what the first post purchase email can contain:
A simple thank you (if a new shopper)
a thank you + an option to redeem last order’s loyalty points (if an existing shopper)
How to measure email marketing success in eCommerce, the right way
Tracking when and how you measure matters just as much as what you track.
a. Catch seasonal trends
Monthly or daily data doesn't inform you of where you're heading towards. It's only when you compare that the data makes some form of sense. After all, the past always has significance.
What to do:
Track opens, CTOR, and conversions on a rolling basis (weekly & monthly).
Layer in year-over-year comparisons – see if the same dip happened last March, or if this year’s July sale outperformed last year’s
Split by category or product type – seasonality might not affect your whole store evenly. Maybe candles spike in winter, but skincare doesn’t
Use tags like “Holiday Campaign,” “Back-to-School,” “Clearance” so you’re comparing the same campaign types
Plot engagement heatmaps across the calendar to surface trends you didn’t even know were happening
Pro Tip: Create averages for each campaign metric of the last 3 years. Use these averages as benchmarks to cross for your email marketing calendar.
b. Differentiate noise from signals
Measuring your email marketing KPIs weekly will help you spot spikes from promos, time-sensitive offers, or subject line tests.
However, it’s the monthly reviews that will show you whether things are actually trending up – or if you're just chasing peaks.
Example: A 40% open rate on one campaign looks amazing – until you realize the rest of the month averaged 18%. Was it a one-off hit or part of a new pattern? You won’t know unless you zoom out.
What you can do:
Compare weekly open/click/conversion rates across the last 4–6 campaigns
is this shift in engagement happening in one campaign type (or, in flows too)
c. Optimize cadence
Measuring only “total opens this month” won’t show whether bumping sends from 2→3 times a week hurt your deliverability or just gave you a boost in revenue. What you can do:
Zoom in on each send, not just monthly totals. Track open rates, CTOR, revenue, unsubscribes, per campaign
Tag campaigns by send frequency (e.g., “2x/week,” “3x/week”) and compare how each campaign affects unsubscribes, spam complaints, and revenue-per-email
A/B test cadence across audience segments:
Power users (high CLTV, repeat buyers) might want a 3x/week follow-up – especially if it's educational, like “How to use X better” or “Best picks this week”
New subscribers or low-engagement users? Might need a slower ramp-up – 1x/week or biweekly, till they warm up
Pro Tip: Track how cadence changes affect campaign ROI over 4 to 6 weeks – sometimes revenue drops later due to churn, not right away.
Your eCommerce email calendar probably has mid‑quarter flash sales, seasonal launches, or annual irl events to promote. But a calendar alone can’t win – shoppers need to feel why each moment matters to them.
Email works best when it’s not just timely for you, but timely for them. That means blending business milestones with shopper lifecycle stages, community moments, and personalization cues.
What you can do:
Tag and track by campaign type – flash sales vs product drops vs. seasonal promos – treat them separately when measuring email marketing success
Split flows vs bulk campaigns – consider using lifecycle email flows to help anchor your brand in the customer’s world – and bulk campaigns should feel just as personalized
Make high-value sales (like Black Friday) even more attractive for your community – provide benefits like early access to loyal shoppers or 4x rewards for shopping early (or, for hitting the AOV)
Plan ads and socials to echo email themes – the shopper experience should feel cohesive, not fragmented
Measure long-term value from high-intent events – e.g., did Q4 buyers churn or stay loyal post-sale?
e. Change tracks in time
If unsubs spike after a send, you want to catch it that day – not in your Friday wrap-up.
What to do:
Set up real-time or daily alerts for spikes in:
Unsubscribes
Spam complaints
Hard bounces
Make room to pause, tweak, or re-segment while the campaign’s still live
– What is the difference between Goals, Metrics, and KPIs?
KPIs and metrics live in the same measurement ecosystem, but here's where the difference is:
Goals = What you want to achieve
Metrics = What you can track
KPIs = The metrics that matter most for your goal
For example, let’s say you want to increase your email marketing revenue by 30% in the next quarter (which is a specific, measurable, attainable, and time-bound goal).
So, to achieve this goal, your KPIs can be:
Open Rate – If subscribers don’t open your emails, they can’t convert (in most cases)
CTOR – If people don’t click after opening, it doesn’t matter
Conversion Rate – Do people actually convert in your email drips and campaigns
Engagement Over Time – Do people keep coming back to your emails
Churn/Unsubscribe Rate – How many people are leaving your list and your store
Remember: All KPIs are metrics,but not all metrics are KPIs.
– What if my online store gets traffic from emails... but no conversions?
What might be going wrong:
❌ Your traffic might be too info-led, not intent-led. If folks are showing up for blogs or freebies, they’re not ready to buy
❌ The landing page doesn’t match the email vibe. They clicked expecting one thing, and landed somewhere else. That disconnect kills flow → You could test alignment here – match the email's voice and offer with the landing page headline
❌ CTAs might be too soft, or buried like treasure – way wayway below the fold
❌ Something’s jammed in checkout – maybe shipping fees, maybe the form’s a pain → Don’t just test UI tweaks – fix the real friction: show total cost earlier, simplify steps.
❌ Great subject line… flat content. If the inside doesn’t match the tease, people bounce
❌ Mobile experience might be ruining the vibe. If the email’s not thumb-friendly or just broken in dark mode, it's not happening
❌ The layout might be messy or cluttered – people skim, so guide the scroll → Test clean vs content-heavy formats. Simpler might actually convert better.
– Why do customers open post-purchase emails but never reorder?
What might be going wrong:
❌ You’re not making reordering feel like a no-brainer. No solid reccos, no reason to come back
❌ Timing might be off – either you’re too eager or too slow → Test email gaps based on product usage. No one needs moisturizer reminders in 2 days.
❌ Emails feel like copy-paste, not personal → Just be original instead: “Thanks for your order!” followed by “Buy again (with something new)?”
❌ You’re not spelling out the why now. A reorder needs a nudge – free shipping, a loyalty bonus, whatever builds urgency
– Why does my abandoned cart email get clicks… but not checkouts?
What might be going wrong:
❌ You’re reminding them they left something – but not giving them a reason to go back
❌ You’re not addressing why they bailed – was it price, shipping, or “do I really need this?” → Add blocks that counter objections: “Free returns,” “Ships by Friday,” “Only 2 left.”
❌ Checkout might still be the villain. If mobile sucks, no one’s pushing through
❌ No urgency = no action. A gentle “We saved your cart” might need a stronger backup like “It’s going fast”
– Why are people unsubscribing after promo emails?
What might be going wrong:
❌ You’re blasting too many promos, too often
❌ Emails all feel the same – you maybe screaming "discount, discount, discount" — but, where’s the value?
→ Try a softer re-engagement email flow before hitting a subscriber with the next promotional email burst
❌ No preferences = no power. People want to choose how often they hear from you


.svg)

.svg)

.svg)
.svg)
