Ecommerce Growth
Shopify Metrics: Which Ones to Track + Ways to Improve
May 20, 2025


As a Shopify store owner, you must know data helps pave the road to better conversions.
But which Shopify metrics should you track?
Here’s a list of the most important Shopify metrics to track so you’ll always know how your store is performing.
The Shopify analytics page is regularly updated with the data within about 1 minute.
If you need to see new data, you can reopen the dashboard or refresh the browser page.
The daily data on your analytics page might update within 48 hours after it's initially processed and published.
For example, your sessions over time and online store conversion over time reports might update because your traffic data is calculated within a minute, and unwanted bot traffic can end up included in the data.
Tests to determine this type of traffic are run and can take up to 48 hours to complete.
If these tests find unwanted traffic, then the unwanted data is removed from your reports.
Let's get started!
Littledata surveyed 2,794 stores and found the average average order value was US$ 101.
The average order value (AOV) is a key metric for any Shopify store. This Shopify metric gets you answers to questions around the value of your orders: How much customers spend each time they buy? Are the bundles, upsells, and tiered discounts working?
It represents the average amount of money that each customer spends on their order.
The AOV can be used to track sales performance, identify trends, and make pricing decisions.
The AOV can vary significantly from one store to another.
Some factors that can affect the average order value include:
Keep in mind – Don’t consider AOV in isolation.
You should also consider other metrics, such as conversion rate and customer lifetime value when making decisions about your store’s business goals.
Is this metric available on the Shopify analytics page?
Yes.
Shopify's analytics or reports often provide AOV directly. Look for sections or reports that detail sales metrics, order values, or average transaction amounts.
Recommended reading: How To Improve Average Order Value On Shopify: 22 Brilliant Ideas
What does Shopify’s conversion rate metrics help you find? Answers to nuances like: Are there too many steps before shoppers reach checkout? Are product pages doing their job? Are customers just waiting for a discount?
A Shopify survey does show the average conversion rate is around 1.3%.
It’s important to understand that a "good" or “ideal” conversion rate depends on the industry, business goals, traffic channel, and audience demographics, among other factors.
Littledata surveyed over 3000+ stores and found the following data:

This Shopify metric refers to the number and percentage of sessions in which shoppers added one or more items to their shopping carts.
This amount is usually smaller than the total number of shoppers because some shoppers view the products in a store without adding to cart.
Littledata found the average add-to-cart rate was around 5.1%.
Is this metric available on the Shopify analytics page?
Yes.
The reached checkout rate is a Shopify metric that refers to the number and percentage of sessions in which shoppers added one or more items to their shopping cart, proceeded to the checkout, and performed an action (for example, a key press or mouse click).
This number is usually smaller than the add-to-cart rate metric because some shoppers add items to their cart but don't go to the checkout or don't submit their contact information.
Is this metric available on the Shopify analytics page?
Yes.
Cart abandonment rate is a metric that measures the percentage of online shoppers who add items to their cart but then fail to complete the checkout process.
It’s calculated by dividing the number of abandoned carts by the total number of carts created.
A high cart abandonment rate can indicate a number of problems, such as:
Extra costs (55%)
Account is required (34%)
Long checkouts (26%)
Unclear pricing (21%)
Don't trust the site (17%)
To reduce your Shopify cart abandonment rate, you can:
Is this metric available on the Shopify analytics page?
Yes.
Shopify's analytics or reports might provide insights into checkout behavior and abandonment rates directly.
Look for sections or reports that detail the checkout funnel or abandonment metrics.
The “sessions that completed checkout” report in Shopify records the number (and percentage) of sessions that recorded a completed payment to reach the order confirmation page.
Remember: Shopify doesn’t stitch the checkout process into a funnel – it only shows the total number of sessions that completed checkout (not unique visitors).
This metric is usually the smallest, but the drop off shouldn’t be more than 60% – according to Littedata, more than 45% of shoppers drop off on mobile.
This can mean:
- no mobile payment options
- your payment gateway fails
- way too many form fields
- discounts don’t auto-apply
Use the ‘Checkout conversion rate over time' Shopify report to:
If many sessions reach checkout but don’t finish, test form fields, payment options, and auto-applied coupon codes.
Is this metric available in the Shopify store analytics dashboard?
Yes. Available under the checkout behavior reports on the Shopify analytics dashboard.
Also read: Your Shopify Store Has Traffic But No Sales? 23 Possible Causes (& Solutions)
This Shopify metric shows the overall quality of your site’s traffic and helps you answer things like: Do certain locations convert better? Do people coming in from Instagram just window shop?
Littledata surveyed 5000+ Shopify stores and found average sessions per user to be around 1.4.
This means, most stores see a high bounce rate as well.
This Shopify metric displays the number of sessions on your online store and what kind of device was used to access your store.
The most common device types are mobile, desktop, and tablet.
Data shows:
Is this metric available on the Shopify analytics page?
Yes.
This Shopify metric displays the number of sessions on your online store sorted by country.
Through this data, you can tweak your marketing campaigns for more conversions.
Is this metric available on the Shopify analytics page?
Yes.
This Shopify metric displays the number of sessions on your online store based on how the visitors accessed your store.
A session occurs when someone does a search or enters the URL of your store directly, for example.
The most common traffic sources are search, direct, social, and email.
The traffic source cannot always be determined, so an unknown traffic source is also common. This metric applies to your Online Store channel only.
Is this metric available on the Shopify analytics page?
Yes.
This Shopify metric displays the number of sessions on your online store originating from social media sources.
These sources can be Facebook, Instagram, YouTube, or Twitter. This data can help you focus your marketing efforts.
Is this metric available on the Shopify analytics page?
Yes
Returning customer rate is a metric that measures the percentage of customers who make a second purchase from your store.
It’s calculated by dividing the number of repeat customers by the total number of customers.
A high returning customer rate indicates that a retailer is doing a good job of retaining customers and providing them with a positive shopping experience.
Or, in simple terms, this Shopify metric shows how strong your retention game is: Are customers coming back? Or are you stuck in acquisition mode?
Here are some tips for improving your returning customer rate in Shopify:
Is this metric available on the Shopify analytics page?
Yes.
On the Shopify analytics page, look for reports or sections that provide insights into customer behavior and retention.
Shopify also offers specific metrics or reports related to customer retention and repeat purchases.
The ‘sales by traffic source’ metric tracks the total sales generated by each traffic source. It connects the dots between traffic and revenue and answers: Which sources drive actual sales, not just visits?
It’s a valuable metric for understanding where your customers are coming from and how you can optimize your marketing efforts.
Once you have this information, you can divide the total sales by the number of sessions from each traffic source to get the average sales per session.
This will give you a good idea of which traffic sources are most profitable.
You can also use this metric to compare the performance of different traffic sources over time.
This can help you identify which sources are becoming more or less effective, and make adjustments to your marketing strategy accordingly.
For instance, if you see that your organic traffic is generating more sales than paid traffic, you may want to focus more of your marketing efforts on SEO and content marketing.
On the other hand, if you see that your paid traffic is generating a lot of sessions but few sales, you may need to improve your landing pages or ad copy.
Is this metric available on the Shopify analytics page?
Yes.
On your Shopify admin panel, navigate to the "Analytics" or "Reports" section. Look for a report that details sales performance by traffic source or acquisition channel. Also known as the “Total Sales by Referrer” report.
The ‘Top landing pages’ report in Shopify reveals your best-performing entry points: Which pages hook visitors instantly? Which ones need to be scrapped?

You can further segment this Shopify report to identify which pages get the most traction from search engine results, from ads, or from within internal links.
Here are some tips to improve your landing page conversion rates:
Is this metric available on the Shopify analytics page?
Yes.
To find your top landing pages, you can use the Shopify Analytics dashboard. In the "Traffic Sources" report, click on the "Landing Pages" tab.
This will show you a list of all of your landing pages, ranked by traffic.
Remember – A landing page is determined from the URL of the first page viewed in a unique session.
A session ends after 30 minutes of no activity by a visitor and at midnight UTC.
We recommend you to read: Why Is Your Conversion Rate Low: Possible Causes + Solutions
The "Top Products by Units Sold" metric in Shopify allows you to identify your best-selling products in your Shopify store, in terms of quantity. It also answers: What’s your core hero product? What’s constantly in demand?
This metric helps also you understand customer preferences, popular items, and can guide inventory management and marketing strategies.
Is this metric available on the Shopify analytics page?
Yes.
Within the Shopify analytics section, you can explore reports related to product performance, sales, or inventory.
Look specifically for reports that showcase units sold per product.
Shopify offers detailed reports that display the performance of individual products. Check for metrics related to the quantity of units sold for each product.
The "Top Referrers by Sessions" metric refers to the sources that drive the most traffic or sessions to your Shopify store. Or, simply put, this metric answers: Who’s sending you valuable traffic? Are emails pulling weight?
The metric showcases which external websites, platforms, or channels are generating the highest number of visits or sessions, leading shoppers to land on your Shopify store.
Is this metric available on the Shopify analytics page?
Yes.
Within the analytics section, you can find reports that categorize incoming traffic by sources such as direct traffic, search engines, social media platforms, external websites, etc.
Look for metrics or reports related to "Referral Traffic" or "Traffic Sources" to identify top referrers.
However, in the following types of referrer, certain sources are not included:
Direct: The customer entered your store's URL into their browser.
Search: The customer clicked your store from a search engine's results page.
Email: The customer clicked a link to your store in an email.
Social: The customer clicked a link on social media.
A total orders metric is when you measure the total number of orders placed on a Shopify store in a given time period. You can use this Shopify metric to know: Is order volume over time going up? Does a particular period get a boost in orders?
This metric can be used to track the growth of a store, identify trends in customer behavior, and make informed decisions about marketing and product development.
To calculate the Shopify Total Orders metric, you can use the following formula:
Total Orders = Number of Orders in Time Period
For example, if you have a store with 100 orders in the past month, your Shopify Total Orders metric would be 100.
Here are some ways you can use the Shopify Total Orders metric:
Is this metric available on the Shopify analytics page?
Yes. However, you can’t filter or edit most order analytics reports in Shopify.
⚠ Caution: Shopify treats any edits to an existing order as a new order. So, your best bet is to set alerts every time shoppers request an edit.
Don’t be alarmed by the technical term.
Customer cohort analysis is how stores track customer retention and buying habits.
It groups loyal customers based on when they made their first purchase. It simply answers: Are first-time buyers turning into loyal customers? How long do they stick around?
You can group customers based on shared characteristics or behaviors to analyze their purchasing patterns and behaviors over time.
Customer purchase data, including date of purchase, order value, and customer lifetime value (LTV).
You can create cohorts of customers based on their date of first purchase.
Shopify will then track their purchase behavior over time, such as the number of orders they place, the average order value, and their LTV.
Here’s how you can help improve your customer retention rate in Shopify:
Is this metric available on the Shopify analytics page?
Yes. You can also use this analysis to calculate the churn rate on Shopify.
This Shopify report breaks down performance across channels – and helps you answer: Are online and in-store in sync? Is your marketplace presence growing? Are influencers worth the investment?
Shopify allows stores to sell through various channels.
Sales channels refer to the different platforms or avenues through which merchants can sell their products.
Here are the common Shopify sales points by channels:
Direct
Partner
Other
Is this metric available on the Shopify analytics page?
Yes. The analytics page displays the total sales value associated with each of your active sales channels.
Displays the percentage of online store searches that resulted in orders, out of the total number of online store searches made.
Search conversion is a metric that measures the percentage of customers who click on a search result and then complete a purchase.
Search conversion = the number of completed purchases / the number of search results clicked on.
This metric helps you understand how effective your search engine is at driving sales. It answers: Are trending products easy to find? Is your search experience relevant?
If your search conversion rate is low, it means that customers are not finding what they are looking for or that they are not clicking on the results that are most relevant to them.
Here are some tips to help you rank higher on Shopify:
Is this metric available on the Shopify analytics page?
Yes. It’s viewable as a behavior report under “Search Conversion Over Time”, where you can essentially view (as a funnel) how people go from search to conversions.
What you can check here are: click, add to cart, and purchase rate for sessions launched from searches. You can also collate and compare the data to group by day/month/date ranges.
Remember: The funnel data for search conversions in Shopify can take 12 hours to update.
Also known as “searches by search query” – top online store searches are the most popular searches that people make on your Shopify stores. This Shopify report helps you figure out: What kind of keywords shoppers actually use over certain time periods? How many words do people use to search? Which product names show up?
Top online store searches can be used:
Keep in mind – Top online store searches can vary depending on the time of year, the current events, and the demographics of the online store's customers.
For example, during the holiday season, top online store searches might include gifts, decorations, and toys.
During a major sporting event, top online store searches might include tickets, jerseys, and merchandise.
Is this metric available on the Shopify analytics page?
Yes
This Shopify metric shows the number of searches that show no results.
A high number of searches with no results indicates that your store’s products aren’t optimized to include actual keywords shoppers use.
Use this metric to:
Is this metric available on Shopify analytics?
Yes.
Navigate to Analytics > Reports > Behavior > Searches with no results (you will also show search terms that yielded no results over the past 30 days).
This Shopify metric tracks sessions that do show some results, but no actions. Meaning there’s a misalignment between the query and displayed results.
It suggests that the results aren’t appealing or relevant to the customer's intent, indicating potential issues with product titles, images, or descriptions.
How to use this Shopify metric:
Is this metric available on Shopify analytics?
Yes. Under the behavior report in Shopify Analytics.
The return metrics in Shopify tell you how much of what you sell comes back, and basically help you figure out: What products actually underperform post-purchase? Do returns peak or stay the same across the year?
The average return rate for eCommerce is typically 20% to 30%.
There are several factors that can affect Shopify return rates, including:
How can you reduce my Shopify return rate?
Here’s how to reduce your Shopify return rate, including:
Is this metric available on the Shopify analytics page?
Not directly.
You have to use the “Orders and returns by product” report in Shopify (also extremely helpful to figure out which products are your best sellers).
Filter the ‘Total sales by product’ report to get your ‘returns rate by product’ report, in your selected date range.
Pro Tip: The resulting report will display each returned product's title, the returned quantity, the value of the returns, the total tax applied to the returned products, and the total sales number. Since the report deals only with returns, the total sales number for each product will be negative.
On Shopify, top returned products are those products that have been returned the most frequently by customers.
These products can be identified by looking at the return rate for each product.
There are a number of reasons why a product might be returned. Some common reasons include:
If a product is returned, the merchant is responsible for refunding the customer.
The merchant may also be responsible for paying for the shipping costs of the return.
Top returned products can be a valuable source of information for merchants.
Identifying these products can help stores to take steps to reduce the number of returns. This can lead to increased customer satisfaction and profitability.
Is this metric available on the Shopify analytics page?
Yes. From the “Orders and Returns by Product” report – or you can use the fraud metric in your Shopify dashboard called “Return rate over time.”
A fraud metric, you can use the “returns over time” Shopify metric to figure out if returns drop or not, over time (shows historical trends in return rate as well).
Consider using this Shopify metric to:
Track it over weeks/months/quarters and use this Shopify metric to check:
Is this metric available on Shopify analytics?
Yes.
Shopify gross sales are the total amount of money generated by online sales. It gives you a top-line view of revenue before deductions and answers: Are promotions working? Are you trending upward month over month?
It includes the value of all purchased items before adding fees or other adjustments, such as taxes, shipping, discounts, or returns. Includes all sales channels.
It’s calculated by adding up the total amount of revenue from all online sales.
Is this metric available on the Shopify analytics page?
You can use the retail sales reports to see information about your customers' point-of-sale orders based on criteria such as product, SKU, or staff.
The total sales metric in Shopify measures the total value of all orders placed on your store, including taxes and shipping costs. It helps you understand: How much do you make after discounts and returns?
This metric is a good indicator of the overall health of your business and can be used to track your progress over time.
How is total sales calculated:
Total sales = Gross sales − discounts − returns + shipping + taxes.
Is this metric available on the Shopify analytics page?
Yes.
To find your total sales, go to the Reports tab in your Shopify admin and select the Sales report.
You can then filter the report by date range to see your total sales for a specific period of time.
The Sales by discount or the Sales by discount code report in Shopify shows you which discount codes (manual or automatic) drive the most revenue in your store.
This report groups sales by discount name, – which helps you answer things like: How often is a particular discount code applied? Are discounts converting into actual revenue or just eroding margins?
A couple of things to know:
Knowing which discounts drive the most sales (and at what cost) helps you fine-tune your promotional strategy — especially during campaigns like BFCM, product launches, or clearance runs.
Is this metric available on the Shopify analytics page?
Yes. Go to: Analytics → Reports → Sales by discount
This report (earlier known as “total sales by product”) shows how much revenue each product brings in — minus shipping.
It helps you identify your best sellers and compare sales trends across SKUs.
A few caveats:
This report is perfect for spotting product performance patterns, understanding where your revenue is coming from, and planning inventory or bundles accordingly.
Is this metric available on the Shopify analytics page?
Yes.
Product-level insights help answer the big questions around inventory: What’s selling fast? What’s sitting too long? What’s bringing in most of the revenue?
These Shopify metrics help optimize your merchandising, stock management, and pricing strategy.
Sell-through rate (STR) measures what percentage of your inventory was sold within a defined period — usually a month.
It’s one of the most effective ways to spot fast-moving SKUs, adjust reorder timing, and minimize unsold stock that ties up capital.
Formula: Sell-through rate (%) = (Units sold ÷ Starting inventory) × 100
Let’s say you started the month with 100 units of a product and sold 80 — that’s an STR of 80%.
High STR = highly in-demand, reorder ASAP.
Low STR = your inventory’s getting inventory, consider bundling or discounting.
Is this metric available on the Shopify analytics page?
Yes.
Pro tip: Cross-check with the Inventory sold daily by product report to understand how consistently a product sells.
This Shopify inventory report is an extension of STR — showing the percentage of received inventory sold during a period. Tells you which variants sold
It’s useful for daily or weekly check-ins, especially during promotional cycles or high-volume sales seasons.
Example: If you received 200 units of a new product and sold 150 in the first week, that’s a 75% sell-through within 7 days.
Is this metric available on the Shopify analytics page?
Yes. Go to: Analytics → Reports → Inventory → View "Products by percentage sold"
Month-end inventory gives you a snapshot of remaining stock at the close of each month for the last 3 years— crucial for accounting and forecasting. You can also use the month-end inventory value report to get an idea of the value of your monthly inventory.
Inventory sold daily by product helps identify sales velocity — whether items sell steadily or in bursts.
This can reveal patterns like:
Use these Shopify metrics to:
Is this metric available on the Shopify analytics page?
Yes. Go to: Analytics → Reports → Inventory sold daily by product / Month-end inventory snapshot
How valuable is your inventory – and how much of it is actually moving?
The ‘Month-end inventory value’ Shopify report gives you the total value of all your stock. But if you want to know which products are really pulling their weight, the ‘ABC analysis by product’ Shopify report goes a step further.
It ranks products based on how much revenue they bring in – and what they’re costing you.
Here’s how this Shopify report classifies inventory value:
Use this Shopify metric report to:
In short, this Shopify report helps you figure out which items are worth doubling down on and which ones have turned into slow-selling inventory.
Is this metric available on the Shopify analytics page?
No, but it is available over the older versions of Shopify Analytics under the “Previous custom reports” – or you can download your Shopify data manually.
This Shopify product analytics metric shows the percentage of your total sales that were influenced by product recommendations — typically through "You may also like" widgets or "Frequently bought together" sections.
It's a key signal of how well your cross-sell and upsell strategies are performing.
Why this Shopify metric matters: Shopify stores using smart recommendations can increase AOV by 10–30%, especially when personalized. You’ll want to monitor this metric over time to see if recommendation performance is improving – or plateauing.
Is this metric available on the Shopify analytics page?
Yes. Under Shopify’s behavior reports.
The actual data of what’s bought together is also available under the Items bought together report, under Order reports
These reports show:
The RFM customer analysis report helps Shopify merchants identify and segment high-value customer groups without doing the manual work of downloading data. This Shopify customer analytics report tells you: Who are your best customers? What does your average purchase cycle look like?
RFM stands for Recency, Frequency, and Monetary value — a scoring system that helps group customers based on:
Where you can use this Shopify report:
Some factors that influence RFM scoring:
Is this report available in Shopify analytics?
Yes. Analytics → Reports → Customer behavior → RFM analysis.
“How much will shoppers go on to spend?” – is exactly what this report predicts. Shopify’s predictive analytics report groups customers into ‘High’, ‘Medium’, and ‘Low’ spenders, based on:
You can use this Shopify report in sync with your RFM analysis report to tailor your messaging and strategy by CLTV (customer lifetime value) – for example:
Is this report available in Shopify analytics?
Yes. Customers → All Customers → Filter by “Predicted Spend Tier”
Further Reading: 29 Conversion Metrics Smart eCommerce Founders Track
As a Shopify store owner, your everyday life must be filled with terms like “conversion rates” and “conversion rate optimization”.
Here are some ways to improve Shopify conversion rates:
To analyze your Shopify Analytics data, you can use the following tools:
Here are some tips for analyzing your Shopify Analytics data:
For more information on analyzing Shopify Analytics data, please refer to the Shopify Analytics documentation.
Shopify Analytics and Google Analytics are both popular website analytics platforms, but there are some key differences between the two.
Shopify Analytics
Pros:
Cons:
Google Analytics
Pros:
Cons:
It’s easy to set up and use, and it provides insights into customer behavior.
However, if you need more comprehensive analytics or if you want to integrate your analytics with your Shopify platform, then Google Analytics is a better option.
Visitors = unique people who visit your store (Shopify has separate cookies for tracking visitors and sessions)
Sessions = measures the no. of visits, expires when shoppers go continuously inactive for 30 minutes or the clock turns 00:00 midnight.
👉 Example: If one person visits your store three times in a day, Shopify will count 1 visitor and 3 sessions. But if one of those visits starts at 11:59 UTC and ends 10 minutes later, it’ll be counted as two sessions.
You’ll often see sessions being higher than visitors — and that’s totally normal. However, your Shopify data won’t match with GA4’s data.
Here’s why: GA4 can track on-site events even without cookies, while Shopify relies heavily on cookie-based tracking. So, even something as simple as a page refresh or someone rejecting cookies can throw Shopify’s numbers off and inflate sessions.
It depends on the metric – and whether it’s a leading or lagging indicator for your store, here’s what we mean:
Leading metrics predict what’s coming next (e.g., site activity).
Lagging metrics confirm what already happened (e.g., revenue results).
Early Lagging / Deeper Leading Shopify Metrics(Check Weekly → Monthly)
Why weekly? You need enough data to smooth out day-to-day noise but still catch emerging trends.
Lagging Shopify Metrics (Check Monthly → Quarterly)
Why monthly? These metrics need a full cycle of data to reveal meaningful shifts in customer behavior.
Pro tip: Set Shopify email alerts or dashboard widgets for key leading metrics (e.g., sessions drop >10%, add-to-cart rate dip >5%). That way, you only dig in when something’s actually broken – which will help keep your focus on the metrics that matter, at the right time.
Open up your Shopify dashboard to access the “Sessions over time” report under “Acquisition” Shopify metrics – and the “Bounce rate over time” report under Shopify’s behavior category reports. Collate the data to accurately track your bounce rate in Shopify. However, we would also recommend checking other store visitation metrics like “average session duration” and the “pages viewed per session” metric in GA4.
Please note: Average session duration and pages viewed per session aren’t directly available on Shopify store analytics.
Also read: 16 Proven Ways To Reduce Shopify Bounce Rate
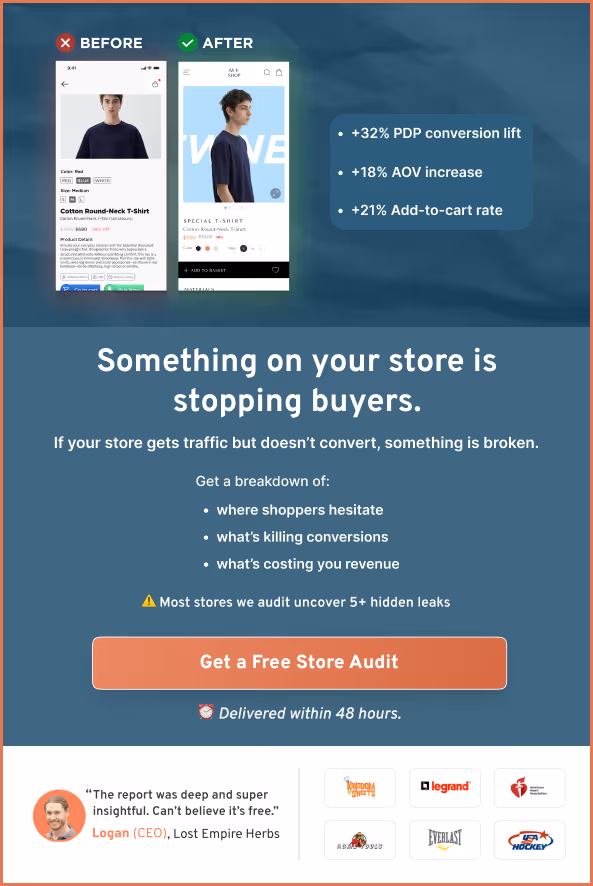
98% of visitors who visit a site—drop off without buying anything.
Why: user experience issues that cause friction for visitors.
And this is the problem Convertcart solves.
We've helped 500+ eCommerce stores (in the US) improve user experience—and 2X their conversions.
Contact our conversion experts to audit your site and skyrocket your eCommerce conversions.
Subscribe for more articles like this!

Read by 5000+ ecommerce store owners
.svg)

.svg)

.svg)
.svg)
2026 Convertcart, All Rights Reserved
33/1, Castle Street, Ashok Nagar, Bengaluru, India