Conversion Optimization
36 eCommerce Metrics and KPIs that Actually Matter
August 18, 2025


“Which eCommerce metrics should I track for my store?” is a question that makes even the most experienced founders stop in their tracks.
So, we’ve decided to put this to the ground once and for all.
In this post, we dive into the ONLY eCommerce metrics to track. However, before we dive in:
But first:
KPIs and metrics are like guiding lights for eCommerce businesses.
They show you what's working well, where things are going wrong, and what's worth your time and money.
Metrics are general data points, but KPIs are metrics with ‘targets’ attached to them.
Put simply, KPIs or key performance indicators are metrics that matter – for example, there can be performance indicators that indicate growth, retention, satisfaction, etc.
For example, think of page views – it’s an eCommerce metric, but the percentage of page views that converted into sales/orders is an eCommerce KPI.
So metrics become KPIs only when seen in your business’s performance – like growth, revenue, or sales.
This also means it’s time to stop worrying about vanity metrics—and only focus on the right eCommerce performance metrics – which leads us to:
The goal of tracking metrics is to arrive at insights. That’s all there is.
Generally speaking, all metrics can be divided into leading and lagging. Meaning, one happens in real time, and the other, you can analyze after it’s happened.
For example, conversion rate is a lagging metric – because you get to know that you’ve got fewer orders compared to the page views, only after it’s already happened.
So, the leading signals that will help you combat a low conversion rate can start by checking if you’ve:
✔️ a spike in bounce rate on PDPs/landing pages
✔️ low average time on page
✔️ low scroll depth
✔️ low add to cart rate.
To sum it up: if you’re not sure which eCommerce KPIs or metrics to track, let these 3 questions guide you:
✔️ Will a change in the metrics affect my business’s bottom line immediately?
✔️ Does improving the metric directly help you meet your business goals?
✔️ Will improving this metric improve other metrics as well?
Goal: check how many sales happen across new and repeat shoppers – the value and time thereof.
Also known as the sales conversion rate, this metric serves both as a sales and UX metric. It measures how many sales your site makes in contrast to the amount of traffic received during a particular time period.
While the average conversion rate for eCommerce stores is around 2%, you can’t improve a low conversion rate by just looking at the percentage.
It’s like trying to lose weight by only looking at your weight on the scale instead of your diet and exercise regimen.
Related Reading: 24 Scientific Strategies to Increase Your eCommerce Conversion Rate
Instead, what you need to do is: break it down – which leads us to our next point 👇
The conversions by device, source, or shopper type metric exists to diagnose where exactly a drop in conversions happens. The goal is to break down by:
✔️ Device – if you see a lower CVR on a particular type of device, you know where you have bad UX
✔️ Traffic Source – like social, organic, etc – this way you know if you’ve bad traffic coming in
✔️ Shopper Type – new vs. returning – if returning shoppers don’t buy, look at your return rate
This way, eCommerce store owners can gain insights into consumer behavior and make fact-based campaign decisions.
Track conversion rate metrics: Monthly. This way, you get a better view, because traffic to conversion ratios may be too hard to analyze on a daily basis.
Remember: Conversion rates differ depending on the industry, and there are various reasons why your conversion rates drop. So, if you’re looking to improve conversion rates, read: *Underrated* conversion rate optimization ideas for eCommerce
Micro-conversion rate is both an engagement and sales metric. It tells you two things:
How to calculate it: (Number of people who do something small, like “add to wishlist”, “use size chart”, “search”, or “sign up”) ➗ (Total number of visitors)
If your micro-conversion rate is low, check your page UX first. Then look at traffic quality.
Example: If lots of people visit your product page, but barely anyone clicks “find my size,” the layout might be dull – or your traffic isn’t relevant.
Keep in mind: A high micro-conversion rate doesn’t always mean high sales.
Example: If people use the search bar but don’t buy, your search results might be off — but hey, they want to buy. That’s still valuable.
Pro Tip: Always compare how many people converted after doing a micro-conversion vs. those who didn’t.
Track Micro-conversion rate: Weekly. Daily, if you’re testing new pages or campaigns.
AOV = total revenue ÷ number of orders (measure the average total of every order placed with a seller over a specific period of time).
While most think this eCommerce metric shows how much the average value of an order is in your store, it really shows what your brand perception is and the type of customer you attract.
A low AOV means people don’t see you as a destination for high-value purchases, or customers aren't finding value in more than one product.
Track AOV: Weekly – especially during promotions or seasonal traffic spikes.
If you’re looking to boost AOV, read this:
Proven upselling strategies with examples for online stores
RPV or per-visitor revenue = Total Revenue ÷ Total Visitors – shows how much money you earn for every visitor that comes onto your website, in a particular period of time.
You can also calculate it as: RPV = Conversion Rate × Average Order Value.
This metric gives you a sense of how long purchases take, and where you might be losing sales volume or value.
For example,
Which is why you should 👇
Track RPV: Daily, Weekly, and Quarterly. Compare RPV across daily, monthly, and quarterly windows to understand how long a typical purchase takes.
Are you using personalization enough for your eCommerce business? Check out : 13 guaranteed ways to boost your revenue with smart personalization
CLTV or Customer Lifetime Value is yet another eCommerce metric that shows how much a customer is worth over their entire relationship with you.
Here’s how CLTV is calculated
CLTV = average order value × average purchase frequency × average lifespan of a customer.
The main goal of tracking this metric is to help you decide how much you can afford to spend on acquisition.
A high LTV can justify a higher initial customer acquisition cost, because you know you will make back whatever you spend in at least 3X (this happens if you have a great repeat purchase rate as well as AOV).
Track CLTV: Monthly or quarterly. You need not track it weekly — unless you have a very short time on shelf.
Goal: Analyze how people browse your product detail pages
This is THE eCommerce metric that shows how many visitors actually consider buying.
A dip here can mean your product page is off (but do look at other signals too, like ‘is there a dip in micro-conversions too?’)
Technically, a micro-conversion, a high add to cart rate indicates you have shoppers who’ve jumped through the hoops of price, trust, and product features.
A recent report shows that the average global add-to-cart rate in 2023 is around 7.83%.
Track ATC Rate: Weekly. Check mobile vs. desktop separately.
Recommended reading:
i. How To Increase The Add-Cart Rate
ii. Why Are People Adding To Cart But Not Buying?
Tells you how many people left your webpage without taking action. A higher bounce rate indicates two things:
- The visitor came for something else
- What you showed them wasn’t compelling enough to stay (like poor copywriting, page layout, or issues with content)
Track this metric by: Set alerts for spikes. Keep a lookout after launching campaigns.
Pro Tip: Some really quick ways to reduce bounce rates:
Looking for more ideas? Do read: 27 Practical Ways To Reduce eCommerce Bounce Rate
Goal: Learn how many people move from cart to checkout.
They liked the product, but not enough to move forward. Or you have a cart page with offers that don’t apply, or a price that jumps suddenly.
The average shopping cart abandonment rate on a global scale stands at 70.21% today.
If you see way too many abandoned carts, check:
Here’s a handy calculator to help you calculate your cart abandonment rate.
Track cart abandonment: Hourly. Set email automations to trigger emails when registered users abandon carts. Set alerts when the rate crosses 80%.
Recommended reading: Powerful ways to reduce shopping cart abandonment (w/ examples)
With the average checkout conversion rate stuck at 2.12% and shoppers spending less, online stores are struggling.
There are many reasons why shoppers drop off from a checkout flow, including:
Track checkout abandonment: In real-time. Review reasons for checkout abandonment manually – especially when it’s a repeat shopper.
Are you trying to reduce the checkout abandonment rate? Here are 27 proven ideas with brand examples
What you really answer with this really important eCommerce metric: If it costs you $50 to acquire a customer who spends $60, will they have to buy from you two or three more times just for you to break even?
Customer Acquisition Cost or Return on Ad Spend is the cost of convincing a target customer to buy a product or service.
Here’s how to calculate customer acquisition cost:
The cost spent on acquiring more customers / the number of customers acquired in the period when the money was spent.
For example, if a company spent $200 on marketing in a year and acquired 50 customers in the same year, then the CAC is $4.
Also, keep a close note of your ‘Payback Period.’
This means, how many months does it take to earn back your CAC? This is essential for subscription models – for example, can a fishing supply store spend $300 to acquire a customer for an $80/month box, knowing they won't be profitable until the fourth month?
Track this metric: Weekly. Daily, if you’re scaling paid campaigns.
How much revenue are you making for every $1 spent on ads? – is precisely what this eCommerce metric shows you.
Tied directly to customer acquisition costs, ROAS is all about managing costs to deliver profit.
Track this metric: Weekly. Always split new vs. returning customers.
Recommended reading: Low eCommerce ROAS? 25 Tested Ideas to Boost Conversions
Also known as the email opt-in rate or subscriber list rate growth, this metric on eCommerce stores shows what’s the percentage of store visitors who become leads through sign-ups.
It’s critical to track this data because nearly 28% of all email lists go stale every year – so fresh signups are always key.
Here’s how to calculate lead generation rate:
The number of leads generated / the number of visitors to the website.
Track this essential metric: Weekly. Test by source (paid, organic, referral).
If you’re looking to generate more leads, here are some timeless strategies that have proven to work.
Goal: Learn which products are most likely to sell the most and the least. Also contains: product metrics.
This eCommerce metric (also doubles as a KPI) tracks which individual products (SKUs) are selling the most in a given time frame.
It helps you:
For example, if a new arrival climbs to your top 5 SKUs within a week, you can move budget to push it harder or reorder early to avoid stockouts.
Track this eCommerce KPI: Weekly.
This shows how fast your inventory is moving (and how much inventory is blocking cash).
Here’s what this eCommerce metric truly shows:
✔️ Low turnover: Might mean overstocking, poor merchandising, or pricing issues
✔️ High turnover: Sounds good (but if you’re constantly going out of stock, check your re-order mechanism)
Track this eCommerce metric: Monthly. Weekly for high-volume SKUs or during peak sales season.
Pro Tip: Combine this with top products sold data to spot what’s moving too fast or too slow. Here’s a quick way to segregate:
Gross profit margin is a metric that is used by eCommerce stores to assess the profitability of their business. It tells you how much you're actually making from each sale before overhead costs.
Here’s how to calculate the gross profit margin
(Total revenue-cost of goods sold / Total revenue) x 100
For example, if your cost of goods sold is $20,000 and your revenue is $60,000. Then your gross profit margin is 20%.
Track this metric: Monthly. But review campaign-wise if you run regular promotions.
Recommended reading: More ways to boost profit margins for eCommerce stores
Goal: Check how well you are able to fulfill orders (delivery KPIs, return rate, etc.)
Customers might forgive a boring email. They won’t forgive a late package.
This measures how many orders reach customers within the promised delivery window.
The goal here is to customize your post-purchase communication, per delivery expectations.
This metric is extremely important because it directly affects repeat purchase behavior, refund rates, and NPS (especially for new customers).
Track this eCommerce success metric: In real-time. Set alerts to trigger when there’s a change in the rate (both positive and negative).
eCommerce returns is the process where customers return products to the store.
Consumers returned products worth a staggering $817 billion—just over 16% of total retail sales.
The National Retail Federation estimates the cost of returns amounts to $101 billion.
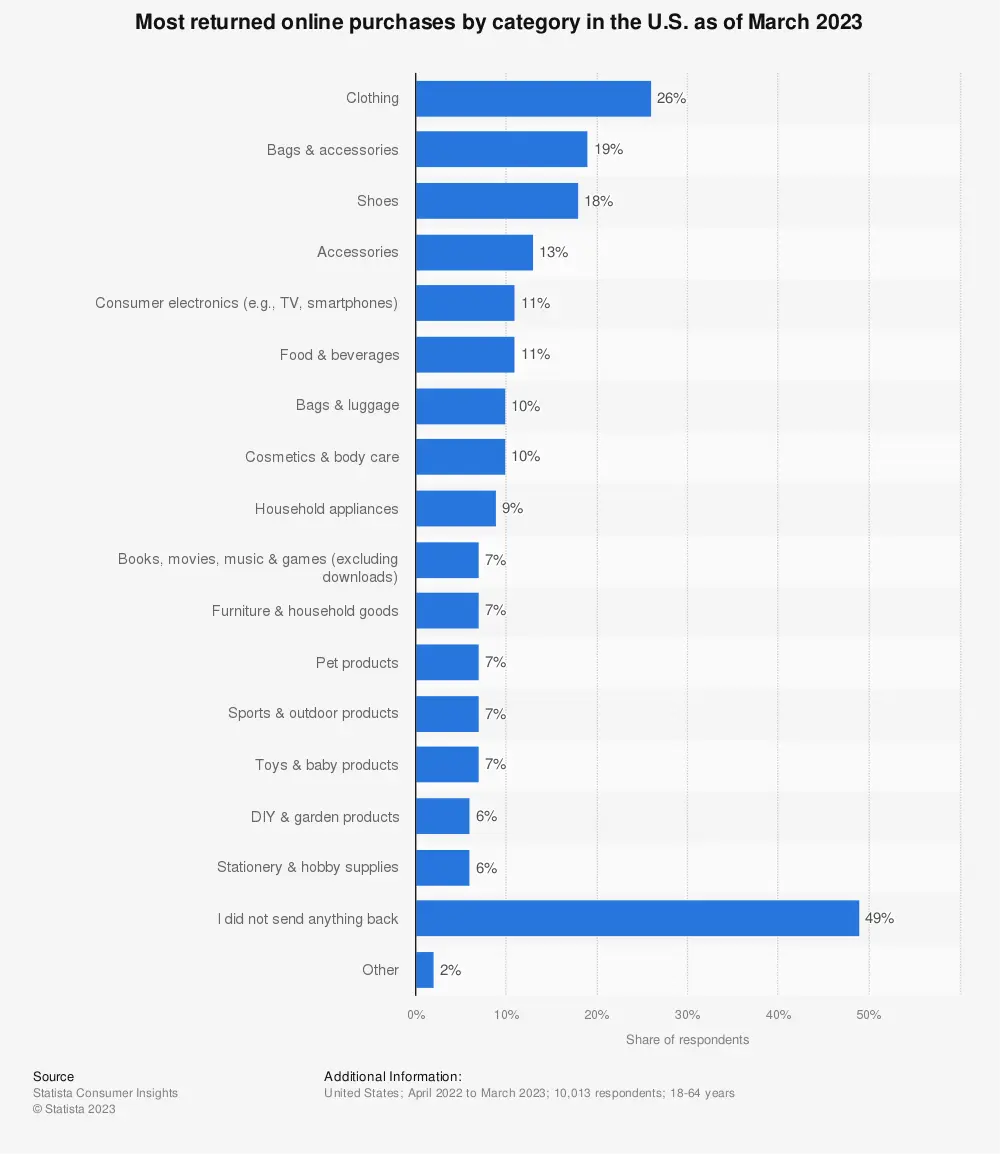
When asked why they returned items, PowerReviews found that 81% of online shoppers said the item was damaged or defective. Other reasons include:
Pro Tip: Always check if a particular SKU or a category shows up as ‘frequently returned’ – then check the respective product pages for ‘size’, ‘fitment’, and ‘reviews.’
Track this metric: In real-time. Set alerts to trigger whenever the return rate goes above 20% (could signal a particular shipment has issues).
Goal: How many people are staying (and likely to refer) – also known as eCommerce growth metrics or eCommerce success metrics
The customer retention rate, a.k.a repeat purchase rate is an eCommerce success metric, that measures the percentage of your customers who come back for another purchase. This metric is important because if retention is low, you’re stuck in acquisition mode forever.
Formula to calculate customer retention rate:
Customer retention= ((CE-CN)/CS)x100
Where,
CS= Number of customers at the start of the measured period
CE= Number of customers at the start of the measured period
CN= number of customers acquired during the period
Track this: Monthly. Compare across cohorts (by acquisition source, product type, etc.)
Recommended reading: Customer retention strategies that actually work
Time Between Purchases metric is the average number of days a customer takes between making two purchases when looking at the past 365 days.
The goal here is to use this eCommerce metric to tailor the timing of your post-purchase replenishment campaigns. For example, if people usually reorder skincare every 28 days, sending a reminder on Day 20 makes more sense than on Day 40.
Here’s how to calculate the time between purchases:
TBP = 365 / (Number of orders in past 365 days/number of unique customers in past 365 days)
Track this: Once per year. Or you can adjust the calculation over 180 days as well.
Net Promoter Score is used to measure customer satisfaction and loyalty by asking customers about their experience and how likely they are to recommend your product to others on a scale of 0-10.
Promoters - They have a score of 9 and 10 and are considered to be the most loyal customers. They help in the overall growth of the company by increasing the referral flows and improving the brand image.
Detractors - They have a score of 0 to 6. They are the customers who had a bad experience or those who are not likely to stick around and make repeat purchases.
Passives - They have a score of 7 and 8. They are the ones who have made a few referrals and with the right strategies can become very close to being promoters.
How to calculate NPS:
NPS = percentage of Detractors - the percentage of Promoters
For example, if 60% of respondents were detractors and 40% were promoters, then your Net Promoter Score will be 20.
Track this metric: Quarterly—or post-purchase after major campaigns.
You must also check out: 20 Solid Ways To Recover BigCommerce Abandoned Carts
The churn rate is the rate at which customers cease to buy from your website.
Here’s how to calculate the churn rate:
(Users at the Beginning of the Period - Users at the End of the Period) / Users at the Beginning of the Period
The churn rate is indicative of how well the company can retain customers and instill customer loyalty.
Ensuring a low churn rate should be your main focus for achieving revenue growth in the long run.
Track this eCommerce metric: Monthly and Quarterly. Always look at churn alongside CAC and retention rate.
Further reading: 20 Powerful Ways To Reduce (And Prevent) eCommerce Churn
Goal: Learn if people are satisfied with your site’s browsing and shopping experience (also known as customer experience metrics).
The live chat performance indicator measures the volume of chat and shows the number of chat sessions that have been launched.
The live chat metric can help you easily identify the popularity of live chat over other customer support channels like calls or emails.
You can also use this eCommerce metric to forecast workload during peak hours and repetitive queries, and make a strategy to segment the work between various customer support teams.
Track this metric: Weekly. Review chat transcripts monthly to spot patterns.
On eCommerce stores, average complaint resolution time is a KPI that determines how much time it takes (usually measured in days) to resolve a customer complaint or other customer support issue.
Stores track the time from when a customer first communicates the problem to when they resolve it.
Reducing the complaint resolution time can significantly improve your customer service experience.
You can also use this metric as an eCommerce KPI to improve your store’s UX in the long run (for example, you can add FAQs to answer the most popular customer objections, or add features)
Track this metric: Daily. Watch for spikes during product launches or seasonal sales.
Goal: Check where your store is showing up, how much you’re spending on average, etc.
Page speed score is a metric that measures the page load time and performance of a web page.
It’s a score out of 100, with higher scores indicating faster loading times.
The page speed score is calculated based on a number of factors, including the size of the page, the number of requests, and the use of compression.
According to Google's CrUX dataset, content takes 2.6 seconds to show up on mobile devices.
The desktop sites are slightly faster, with a load time of 2.3 seconds.
Consequently, on average a normal page load time for real users is therefore in the 2 to 3 second range.
Track this metric: Hourly. Set real time alerts on third-party load-tester tools that run audits every hour.
Recommended reading:
How to speed up Shopify Website
How to speed up BigCommerce Store
Website traffic is an essential KPI for any eCommerce business.
It determines the number of people visiting your website. It’s also a clear indicator of your online visibility and the effectiveness of your marketing efforts.
Research shows that 23.6% of eCommerce sales come from organic traffic.
Track this eCommerce metric: Set alerts for spikes or dips – anything above or below 20%.
You might also like: Getting traffic but no sales? Here’s why (& how to solve)
How many unique people saw your brand or offer? Most eCommerce brands spend tons on ads without actually checking their reach – more often than not, the same audience pool keeps seeing the same offer.
While some may argue for familiarity, it’s important to reach new(er) audiences. If your reach stagnates, check if you:
Track this eCommerce metric when: Conversion rate stalls (on a campaign that was previously performing).
The average session on a website is the average duration of time that visitors spend while viewing your website.
A report shows that the average across all industries is 4.41 minutes. This means a good average session duration would be anything above three minutes.
Here’s how to calculate the average session on-site:
The total duration of all sessions(in seconds) / Total number of sessions
Track this metric: Weekly. Break down by traffic source and device.
Recommended reading: How to increase average session time on your store
Pages per visit is a metric that measures the average number of pages visitors view on a site within a single session.
The average pageviews can be calculated by:
The total number of page views / the total number of visits during the same timeframe
Track this eCommerce metric: Weekly. Correlate with add-to-cart rate and conversion rate.
Also read: What Is A "Good" Funnel Conversion Rate In eCommerce?
Store sessions are classified based on the source they are coming from, i.e., search engines, social media platforms, email, or direct.
You can see this metric in the shop’s analytics tool and improve experiences based on the traffic sources.
Track this eCommerce metric: Weekly. Segment out traffic by source and correlate with conversion rate as well as AOV – this way, you know which source to focus on.
Pro Tip: You can apply the same logic to track the ‘store sessions by device type’ metric.
Do check: 10 Sure-Shot Ways to Boost Your eCommerce ROI
Goal: Learn how people interact with your emails and what happens when they open your emails.
Email click-through rate is an important email marketing metric.
It’s the percentage of subscribers who click on at least one link in the body of an email against the percentage of emails successfully delivered.
The formula for email click-through rate or CTR looks like this:
Emails with at least one click ➗ Emails successfully delivered X 100
For instance, total email deliveries stand at 500, and out of that, only 50 were opened—in this case, the email CTR would be 10%.
Track this eCommerce metric: After every campaign. Compare by segment and email type. Also, run an audit quarterly to check for seasonal trends.
An email subscriber is a shopper or customer who has given your store permission to send them emails.
So, how can you determine email subscriber value:
✔️ Determine your active subscriber count
✔️ See how many direct sales you made from email marketing
✔️ Choose a specific time frame
For example, you’ve:
15,000 active email subscribers (X)
$30,00,00 in annual sales from email marketing (Y)
When you divide Y by X, you get: $20 as your annual email subscriber value.
Track this metric: Monthly. Also check against particular segments and flow types (like cart recovery or welcome emails) – this way, you know which segments and flows deliver the most value.
The Click-to-open Rate is essentially the percentage of subscribers who not only clicked to open your email in their inbox but also clicked at least one link in the email body.
Here’s how to calculate CTOR:
Unique clicks ➗ Unique opens X 100
For instance, you’ve sent an email to 100 people, 50 have opened it, and 25 have clicked on it.
Your CTOR will be 50% in this case.
Track this eCommerce metric: After every send. Pay attention to mobile vs desktop.
An email unsubscribe rate is a KPI that tells you how many subscribers opted out of your email marketing campaigns.
Here’s how to calculate the email unsubscribe rate:
An unsubscribe rate is the number of unsubscribes divided by the number of emails delivered.
For example, if 3000 emails are delivered in your email campaign and 20 subscribers have opted out, then your unsubscribe rate is 0.6%.
Track this metric: Per send. Panic only if it goes above 0.5–1%.
Revenue per email subscriber is an email marketing metric that determines the average monetary value of a subscriber on your email list.
Here’s how to calculate revenue per subscriber:
The total revenue generated from email marketing campaigns / the number of email subscribers
Track this eCommerce metric: Monthly. Use for list quality forecasting.
Return on investment is measured to evaluate the efficiency and profitability of your email campaigns.
Email marketing ROI is typically calculated as follows:
Step 1: Email Marketing Revenue - Email Marketing Costs = Net Profit
Step 2: Net Profit ➗ Email Marketing Costs * 100
So, in real-time, it would look something like this:
If $100, 000 is your email marketing revenue and $20, 000 is the email marketing cost, then net profit would be $100, 000 - $20, 000 = $80, 000
So, ROI then would be:
Net Profit ➗ Email Marketing Costs * 100 = 80, 000 ➗ 20, 000 *100 = 400%
Track this eCommerce metric: Quarterly. Recalculate post-holiday or after running key sales promotions.
Read more: Improving 15 Key eCommerce Email Marketing Metrics – Practical Ideas For Store Owners
Most eCommerce store owners don’t see email as a serious revenue stream.
Ask them about the importance of email marketing, and you'll hear: “We don’t really have a major strategy,” “We mostly use generic templates,” or “We just send emails to people on our list.”
BUT AT THE SAME TIME:
There are stores out there that drive 30%+ of their revenue from email marketing.
Engage can help you do the same - Book a free demo.
We’ll show you:
Subscribe for more articles like this!

Read by 5000+ ecommerce store owners
.svg)

.svg)

.svg)
.svg)
2026 Convertcart, All Rights Reserved
33/1, Castle Street, Ashok Nagar, Bengaluru, India
